Creating, Automating, and Assessing Online Homework in Introductory Statistics and Mathematics Classes
Publication
Metrics
AI Quick Summary
Researchers developed an automated online homework system for introductory statistics and mathematics classes, using tools like Mathematica to generate question pools and software packages like Respondus to upload questions into a course management system. The project improved efficiency and accuracy in grading student performance data.
Paper Preview
Abstract
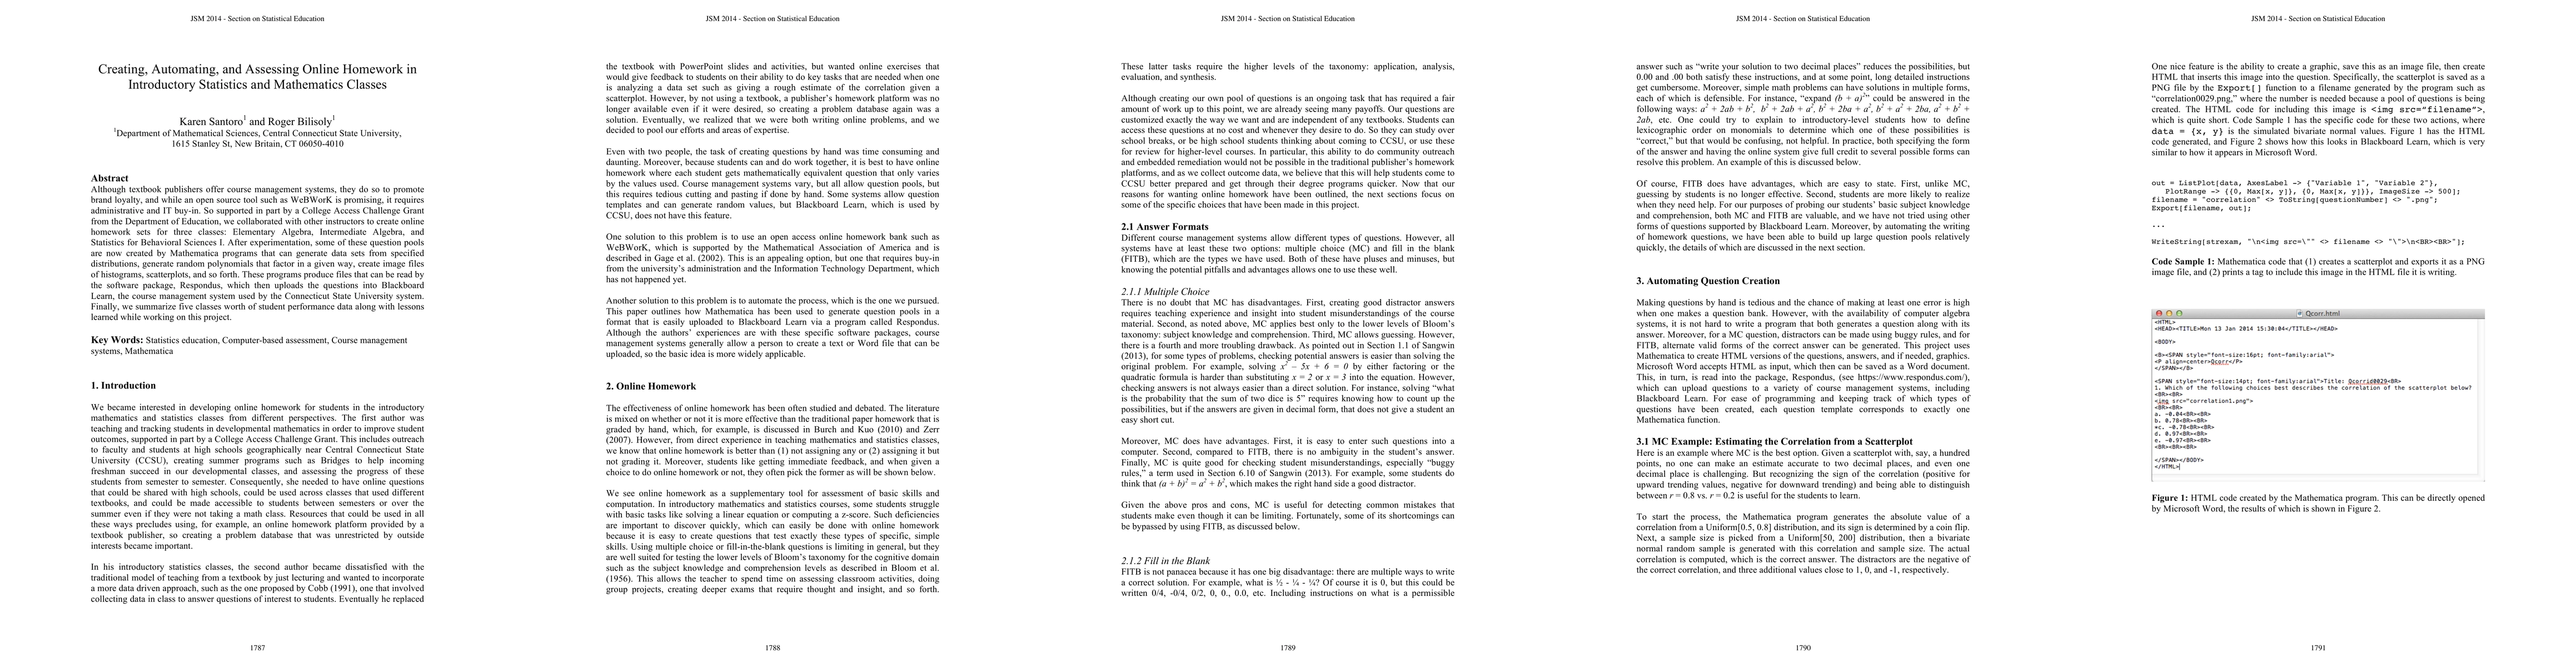
Although textbook publishers offer course management systems, they do so to promote brand loyalty, and while an open source tool such as WeBWorK is promising, it requires administrative and IT buy-in. So supported in part by a College Access Challenge Grant from the Department of Education, we collaborated with other instructors to create online homework sets for three classes: Elementary Algebra, Intermediate Algebra, and Statistics for Behavioral Sciences I. After experimentation, some of these question pools are now created by Mathematica programs that can generate data sets from specified distributions, generate random polynomials that factor in a given way, create image files of histograms, scatterplots, and so forth. These programs produce files that can be read by the software package, Respondus, which then uploads the questions into Blackboard Learn, the course management system used by the Connecticut State University system. Finally, we summarize five classes worth of student performance data along with lessons learned while working on this project.
AI Key Findings
Get AI-generated insights about this paper's methodology, results, significance, and more — seven facets brought into focus.
Impact
Paper Details
PDF Preview
Key Terms
Citation Network
Current paper (gray), citations (green), references (blue)
Display is limited for performance on very large graphs.
Discussion 0