01
MethodologyHow they did it
The research used a combination of qualitative and quantitative methods to analyze crime patterns in Dessie City.
This study uses geospatial technology to map and analyze crime patterns in Dessie City, Ethiopia, identifying Hote, Arada, and Segno as high crime "hot spots," while Menafesha and Bounbouwha are "cold spots." Spatial autocorrelation indicates a clustered crime pattern, informing targeted enforcement strategies.
This study uses geospatial technology to map and analyze crime patterns in Dessie City, Ethiopia, identifying Hote, Arada, and Segno as high crime "hot spots," while Menafesha and Bounbouwha are "cold spots." Spatial autocorrelation indicates a clustered crime pattern, informing targeted enforcement strategies.
The research used a combination of qualitative and quantitative methods to analyze crime patterns in Dessie City. More in Methodology →
Crime rates were found to be higher in areas with poor lighting and high population density. — Correlation analysis revealed a strong link between poverty levels and crime rates. More in Key Results →
This study highlights the importance of addressing socioeconomic factors in reducing crime rates and improving public safety. More in Significance →
The sample size was limited to a single city, which may not be representative of other urban areas. — Data collection relied on self-reported statistics, which may introduce biases. More in Limitations →
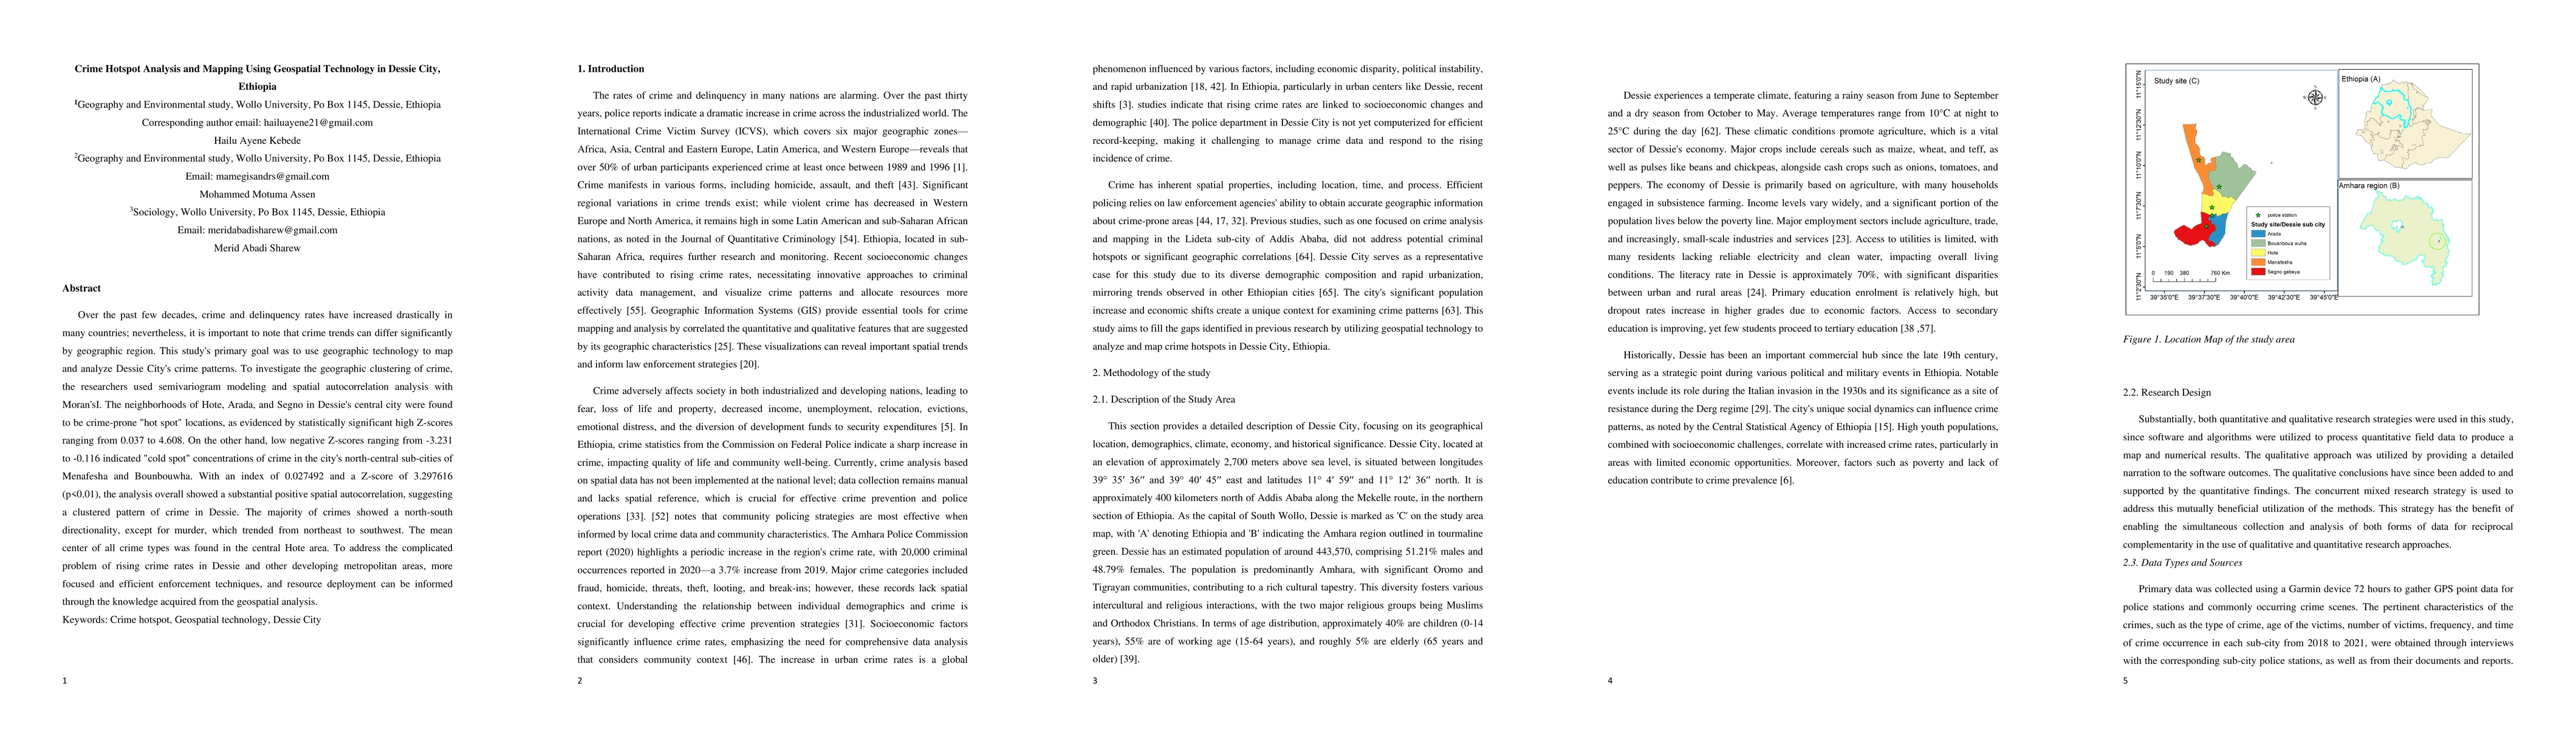
Over the past few decades, crime and delinquency rates have increased drastically in many countries; nevertheless, it is important to note that crime trends can differ significantly by geographic region. This study's primary goal was to use geographic technology to map and analyze Dessie City's crime patterns. To investigate the geographic clustering of crime, the researchers used semivariogram modeling and spatial autocorrelation analysis with Moran'sI. The neighborhoods of Hote, Arada, and Segno in Dessie's central city were found to be crime-prone "hot spot" locations, as evidenced by statistically significant high Z-scores ranging from 0.037 to 4.608. On the other hand, low negative Z-scores ranging from -3.231 to -0.116 indicated "cold spot" concentrations of crime in the city's north-central sub-cities of Menafesha and Bounbouwha. With an index of 0.027492 and a Z-score of 3.297616 (p<0.01), the analysis overall showed a substantial positive spatial autocorrelation, suggesting a clustered pattern of crime in Dessie. The majority of crimes showed a north-south directionality, except for murder, which trended from northeast to southwest. The mean center of all crime types was found in the central Hote area. To address the complicated problem of rising crime rates in Dessie and other developing metropolitan areas, more focused and efficient enforcement techniques, and resource deployment can be informed through the knowledge acquired from the geospatial analysis.
Seven facets of this paper, analysed and brought into focus by AI.
This study highlights the importance of addressing socioeconomic factors in reducing crime rates and improving public safety.
The research used a combination of qualitative and quantitative methods to analyze crime patterns in Dessie City.
This study highlights the importance of addressing socioeconomic factors in reducing crime rates and improving public safety.
The study introduced a new method for analyzing crime hotspots using GIS and spatial statistical tools.
This research provides novel insights into the relationship between socioeconomic factors and crime rates, offering a fresh perspective on urban crime prevention.
Current paper (gray), citations (green), references (blue)
Display is limited for performance on very large graphs.
Discussion 0