Crime Patterns in Los Angeles County Before and After Covid19 (2018-2021)
Publication
Metrics
AI Quick Summary
This research investigates changes in crime rates in Los Angeles County from 2018 to 2021, focusing on patterns before and after the Covid19 pandemic. Utilizing data analysis, geo-mapping, and regression modeling, the study aims to identify correlations between crime rates, demographic factors, and income, providing insights into whether crime trends are influenced by recent socio-economic changes.
Paper Preview
Abstract
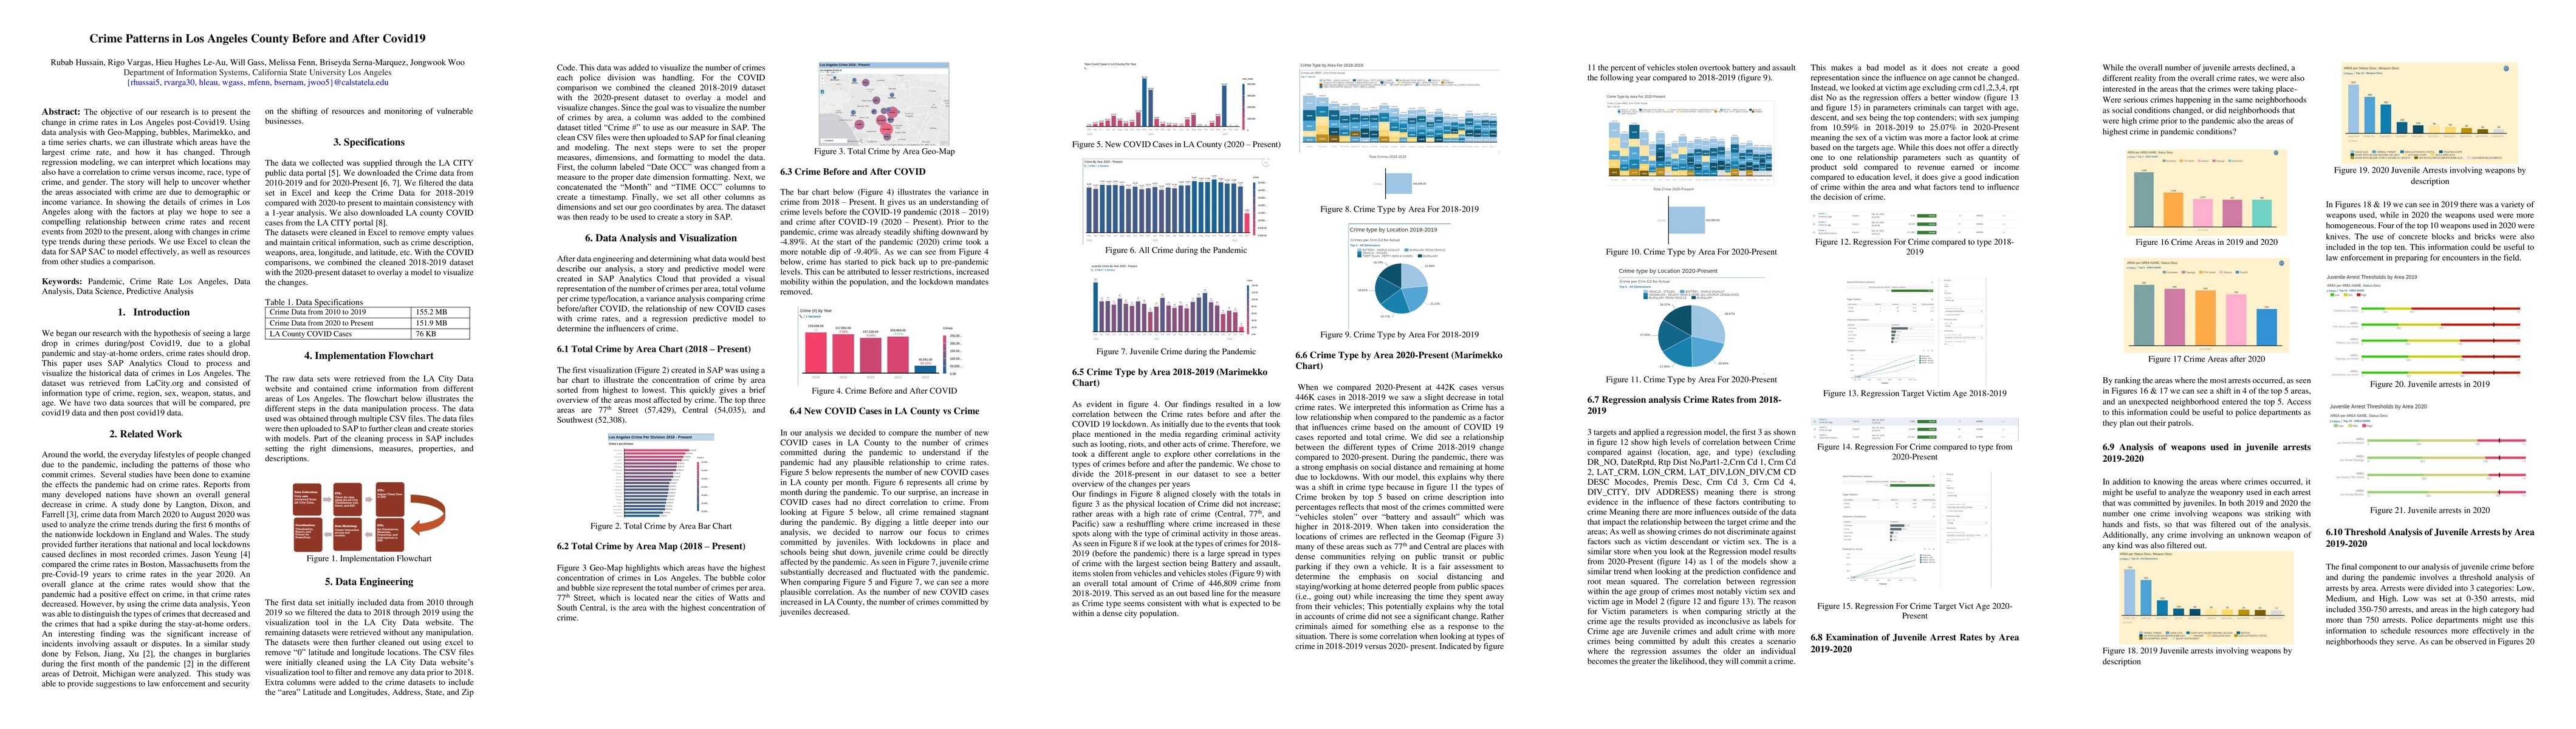
The objective of our research is to present the change in crime rates in Los Angeles post-Covid19. Using data analysis with Geo-Mapping, bubbles, Marimekko, and a time series charts, we can illustrate which areas have the largest crime rate, and how it has changed. Through regression modeling, we can interpret which locations may also have a correlation to crime versus income, race, type of crime, and gender. The story will help to uncover whether the areas associated with crime are due to demographic or income variance. In showing the details of crimes in Los Angeles along with the factors at play we hope to see a compelling relationship between crime rates and recent events from 2020 to the present, along with changes in crime type trends during these periods. We use Excel to clean the data for SAP SAC to model effectively, as well as resources from other studies a comparison.
AI Key Findings
Get AI-generated insights about this paper's methodology, results, significance, and more — seven facets brought into focus.
Impact
Paper Details
Authors
PDF Preview
Key Terms
Citation Network
Current paper (gray), citations (green), references (blue)
Display is limited for performance on very large graphs.
Discussion 0