Summary
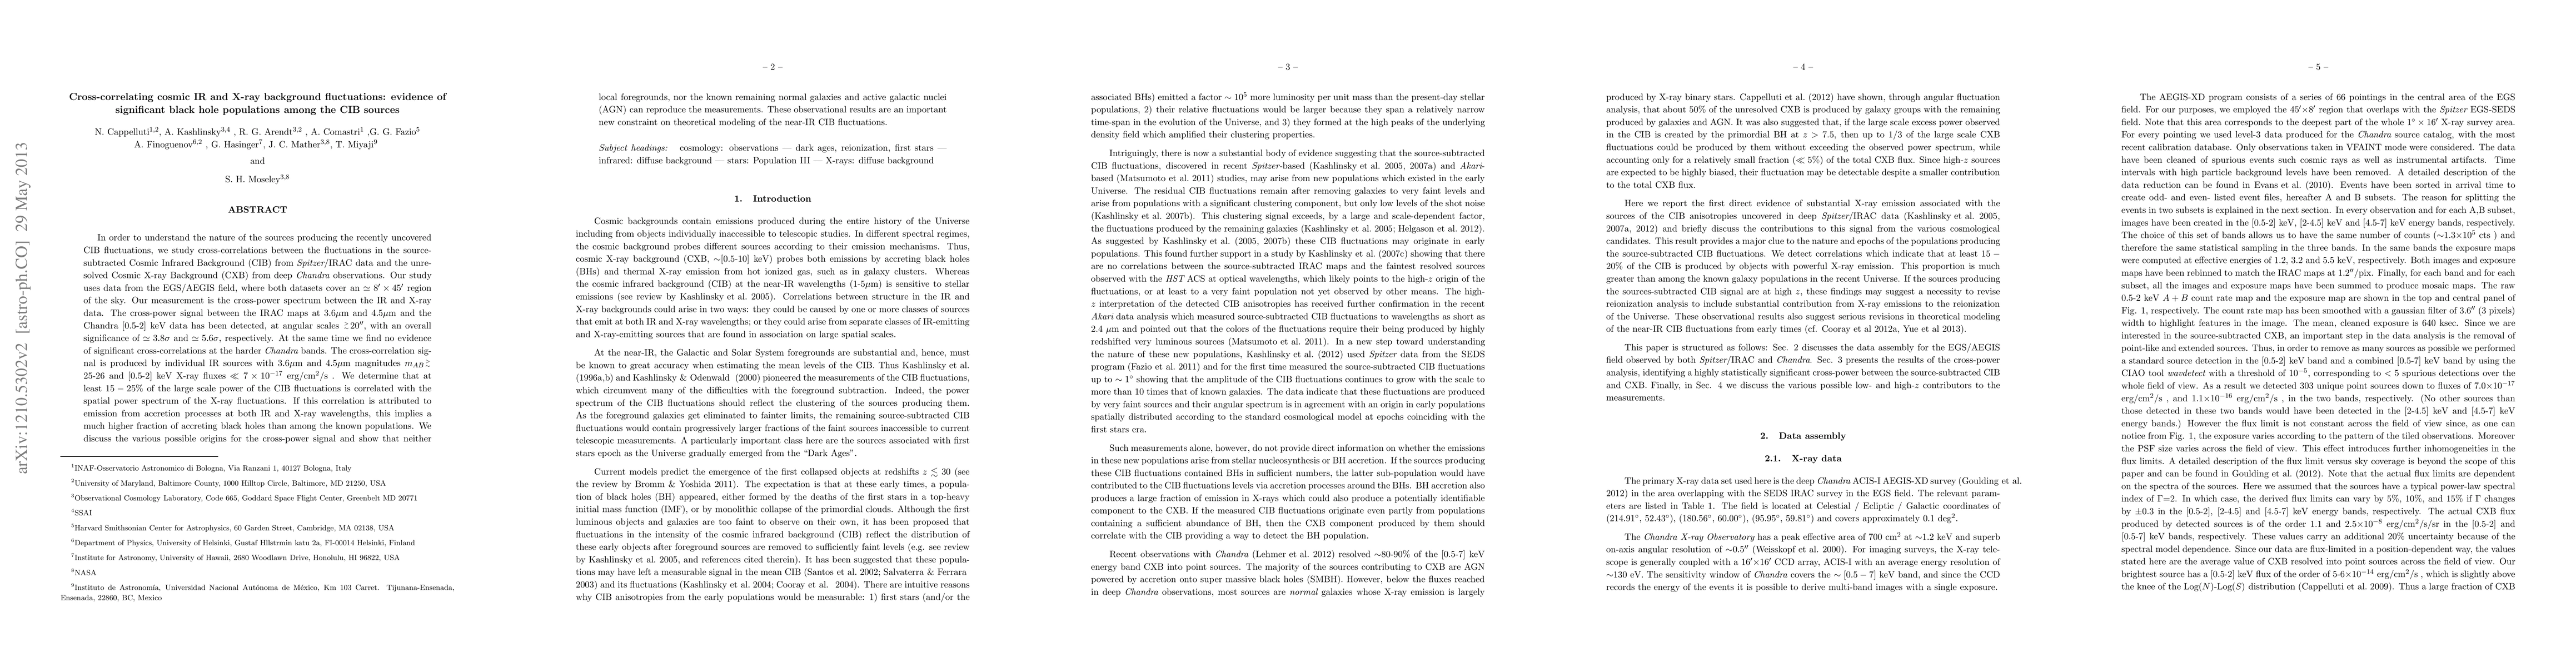
In order to understand the nature of the sources producing the recently uncovered cosmic infrared background (CIB) fluctuations, we study cross-correlations between the fluctuations in the source-subtracted CIB from Spitzer/IRAC data and the unresolved cosmic X-ray background from deep Chandra observations. Our study uses data from the EGS/AEGIS field, where both data sets cover an 8'x45' region of the sky. Our measurement is the cross-power spectrum between the IR and X-ray data. The cross-power signal between the IRAC maps at 3.6 um and 4.5 um and the Chandra [0.5-2] keV data has been detected, at angular scales 20'', with an overall significance of 3.8 sigma and 5.6 sigma, respectively. At the same time we find no evidence of significant cross-correlations at the harder Chandra bands. The cross-correlation signal is produced by individual IR sources with 3.6 um and 4.5 um magnitudes m_AB 25-26 and [0.5-2] keV X-ray fluxes 7e-17 cgs.We determine that at least 15%-25% of the large scale power of the CIB fluctuations is correlated with the spatial power spectrum of the X-ray fluctuations. If this correlation is attributed to emission from accretion processes at both IR and X-ray wavelengths, this implies a much higher fraction of accreting black holes than among the known populations. We discuss the various possible origins for the cross-power signal and show that neither local foregrounds nor the known remaining normal galaxies and active galactic nuclei can reproduce the measurements. These observational results are an important new constraint on theoretical modeling of the near-IR CIB fluctuations.
AI Key Findings
Get AI-generated insights about this paper's methodology, results, and significance.
Paper Details
PDF Preview
Key Terms
Citation Network
Current paper (gray), citations (green), references (blue)
Display is limited for performance on very large graphs.
| Title | Authors | Year | Actions |
|---|
Comments (0)