Cross-correlations between volume change and price change
Publication
Metrics
Paper Preview
Abstract
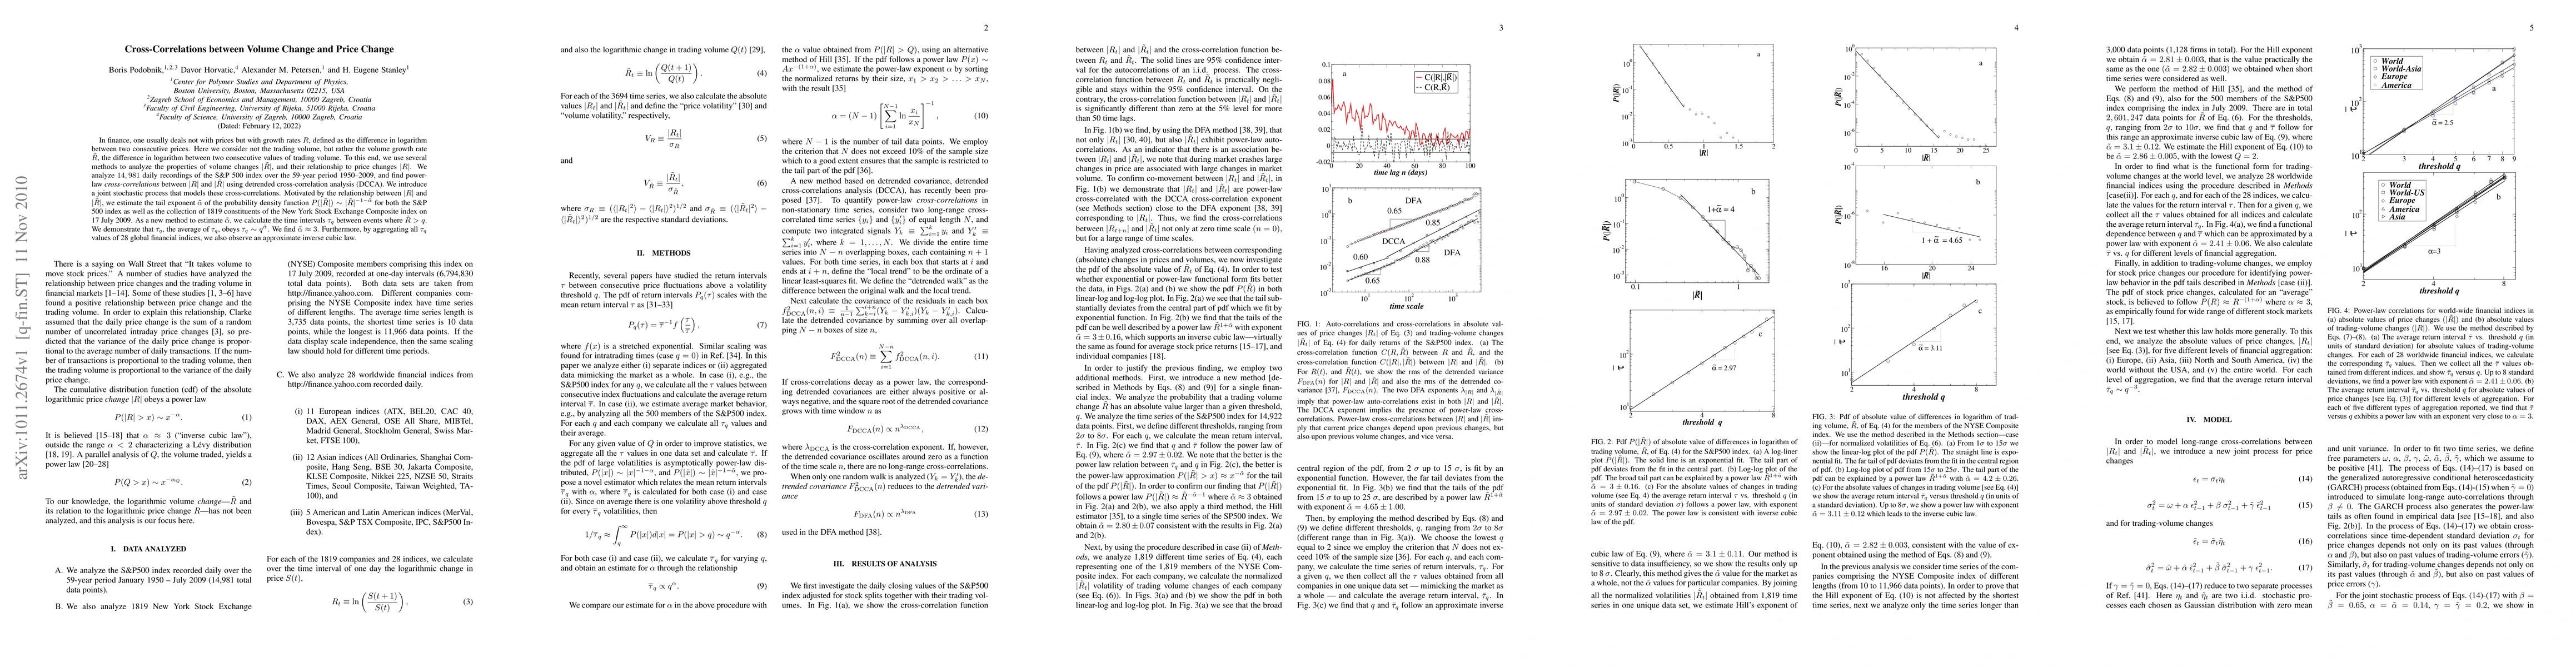
In finance, one usually deals not with prices but with growth rates $R$, defined as the difference in logarithm between two consecutive prices. Here we consider not the trading volume, but rather the volume growth rate $\tilde R$, the difference in logarithm between two consecutive values of trading volume. To this end, we use several methods to analyze the properties of volume changes $|\tilde R|$, and their relationship to price changes $|R|$. We analyze $14,981$ daily recordings of the S\&P 500 index over the 59-year period 1950--2009, and find power-law {\it cross-correlations\/} between $|R|$ and $|\tilde R|$ using detrended cross-correlation analysis (DCCA). We introduce a joint stochastic process that models these cross-correlations. Motivated by the relationship between $| R|$ and $|\tilde R|$, we estimate the tail exponent ${\tilde\alpha}$ of the probability density function $P(|\tilde R|) \sim |\tilde R|^{-1 -\tilde\alpha}$ for both the S\&P 500 index as well as the collection of 1819 constituents of the New York Stock Exchange Composite index on 17 July 2009. As a new method to estimate $\tilde\alpha$, we calculate the time intervals $\tau_q$ between events where $\tilde R>q$. We demonstrate that $\bar\tau_q$, the average of $\tau_q$, obeys $\bar \tau_q \sim q^{\tilde\alpha}$. We find $\tilde \alpha \approx 3$. Furthermore, by aggregating all $\tau_q$ values of 28 global financial indices, we also observe an approximate inverse cubic law.
AI Key Findings
Get AI-generated insights about this paper's methodology, results, significance, and more — seven facets brought into focus.
Impact
Paper Details
PDF Preview
Key Terms
Citation Network
Current paper (gray), citations (green), references (blue)
Display is limited for performance on very large graphs.
Discussion 0