Cross-Dataset-Robust Method for Blind Real-World Image Quality Assessment
Publication
Metrics
AI Quick Summary
This paper proposes a robust blind image quality assessment (BIQA) method using a robust training strategy, a large-scale real-world dataset, and a powerful Swin-Transformer backbone. The method generates pseudo-labels from biased models trained on different datasets, leading to a cross-dataset-robust model that outperforms some state-of-the-art methods.
Paper Preview
Abstract
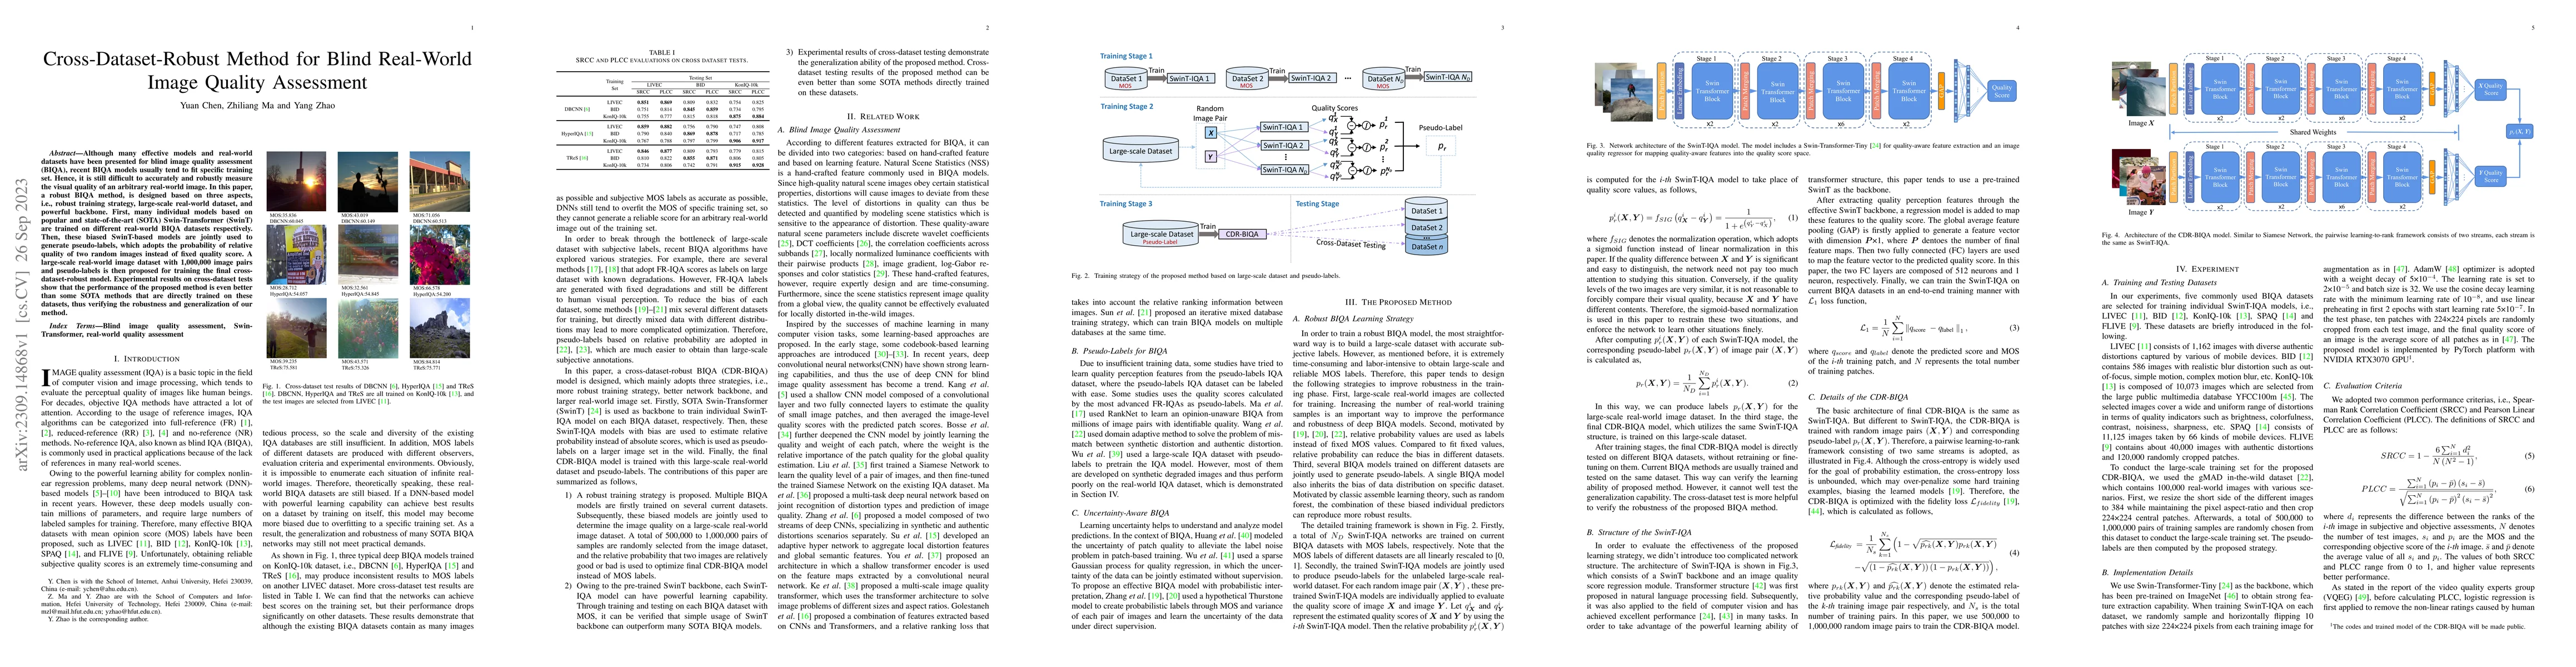
Although many effective models and real-world datasets have been presented for blind image quality assessment (BIQA), recent BIQA models usually tend to fit specific training set. Hence, it is still difficult to accurately and robustly measure the visual quality of an arbitrary real-world image. In this paper, a robust BIQA method, is designed based on three aspects, i.e., robust training strategy, large-scale real-world dataset, and powerful backbone. First, many individual models based on popular and state-of-the-art (SOTA) Swin-Transformer (SwinT) are trained on different real-world BIQA datasets respectively. Then, these biased SwinT-based models are jointly used to generate pseudo-labels, which adopts the probability of relative quality of two random images instead of fixed quality score. A large-scale real-world image dataset with 1,000,000 image pairs and pseudo-labels is then proposed for training the final cross-dataset-robust model. Experimental results on cross-dataset tests show that the performance of the proposed method is even better than some SOTA methods that are directly trained on these datasets, thus verifying the robustness and generalization of our method.
AI Key Findings
Get AI-generated insights about this paper's methodology, results, significance, and more — seven facets brought into focus.
Impact
Paper Details
Authors
PDF Preview
Key Terms
Citation Network
Current paper (gray), citations (green), references (blue)
Display is limited for performance on very large graphs.
Discussion 0