Cross-Domain Comparative Analysis of Digital Twins and Universalised Solutions
Publication
Metrics
AI Quick Summary
This paper compares digital twins across five domains using a six-dimensional framework, identifying principles of universality and variation. It proposes a cross-domain Digital Twin Platform-as-a-Service (DT-PaaS) to facilitate data sharing, interoperability, and development synergy across domains, aiming to address global challenges like climate change and pandemics.
Paper Preview
Abstract
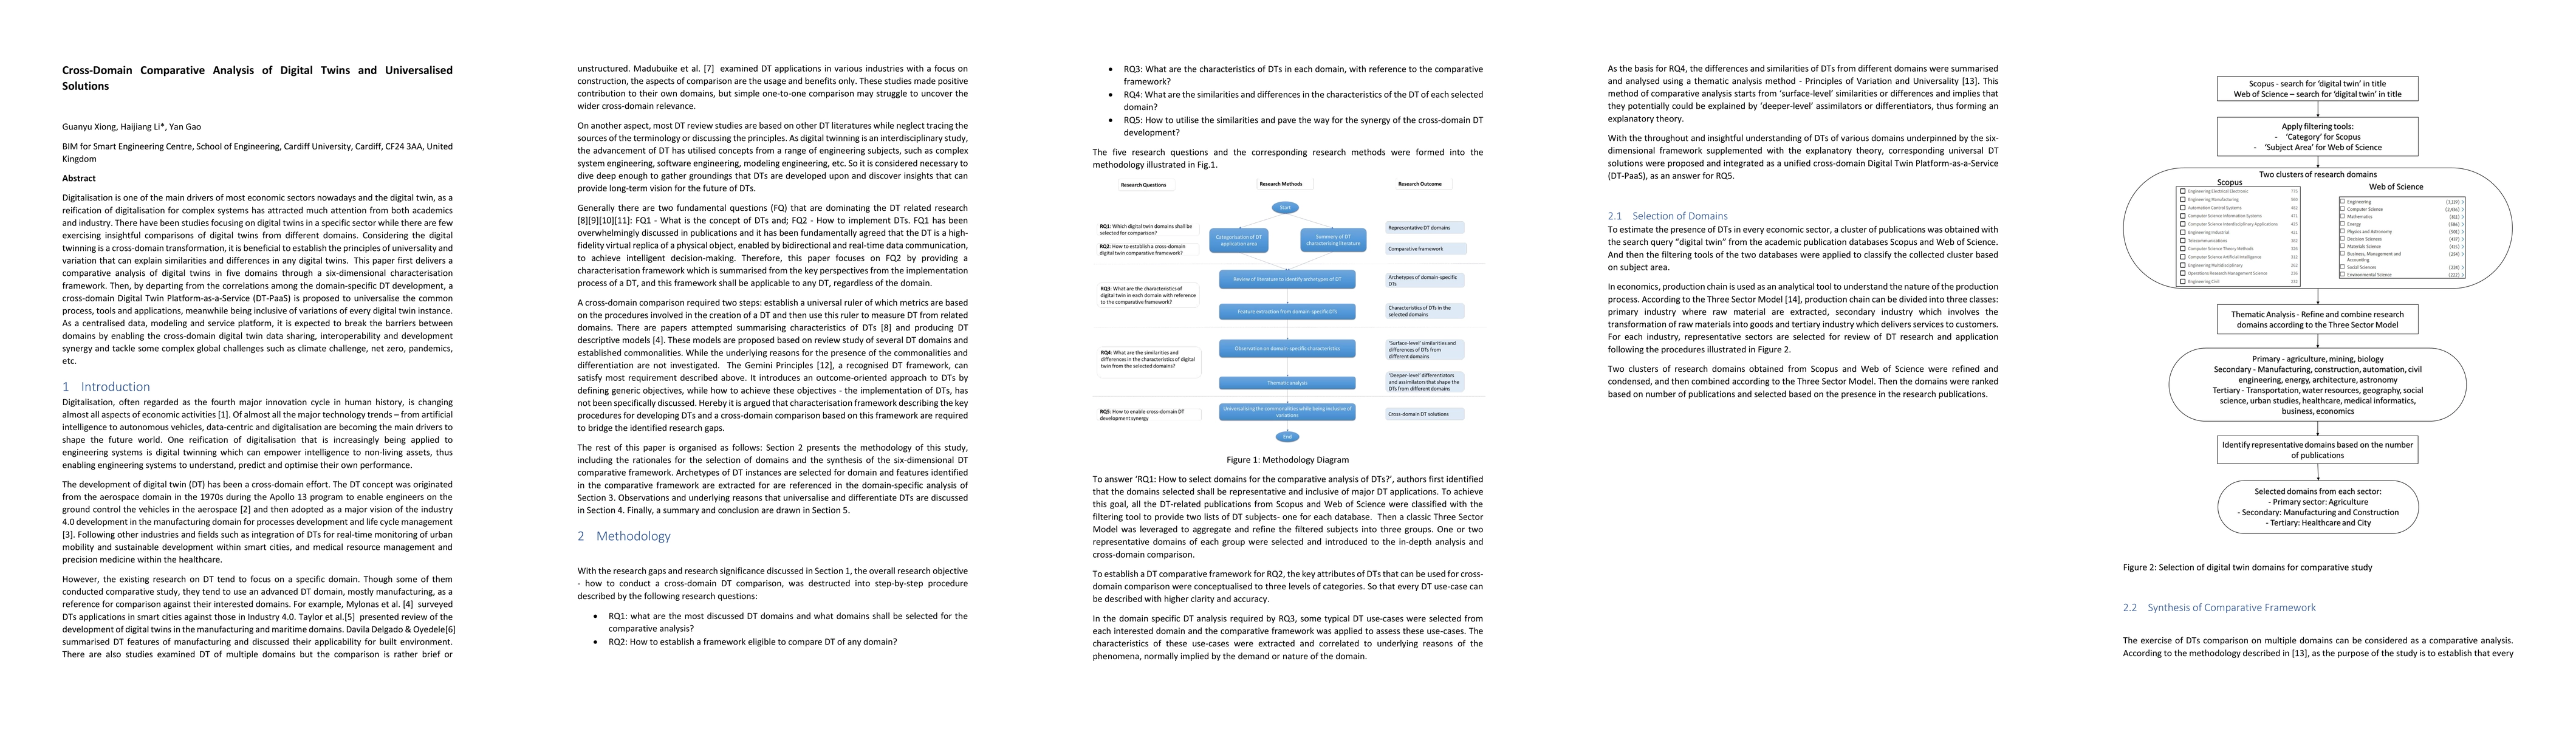
Digitalisation is one of the main drivers of most economic sectors nowadays and the digital twin, as a reification of digitalisation for complex systems has attracted much attention from both academics and industry. There have been studies focusing on digital twins in a specific sector while there are few exercising insightful comparisons of digital twins from different domains. Considering the digital twinning is a cross-domain transformation, it is beneficial to establish the principles of universality and variation that can explain similarities and differences in any digital twins. This paper first delivers a comparative analysis of digital twins in five domains through a six-dimensional characterisation framework. Then, by departing from the correlations among the domain-specific DT development, a cross-domain Digital Twin Platform-as-a-Service (DT-PaaS) is proposed to universalise the common process, tools and applications, meanwhile being inclusive of variations of every digital twin instance. As a centralised data, modeling and service platform, it is expected to break the barriers between domains by enabling the cross-domain digital twin data sharing, interoperability and development synergy and tackle some complex global challenges such as climate challenge, net zero, pandemics, etc.
AI Key Findings
Get AI-generated insights about this paper's methodology, results, significance, and more — seven facets brought into focus.
Impact
Authors
PDF Preview
Citation Network
Current paper (gray), citations (green), references (blue)
Display is limited for performance on very large graphs.
Discussion 0