Crowding Prediction of In-Situ Metro Passengers Using Smart Card Data
Publication
Metrics
AI Quick Summary
This paper proposes a statistical model using smart card data to predict in-situ metro passenger density between stations. It forecasts time-dependent Origin-Destination matrices and estimates travel time costs, demonstrating effectiveness in the Singapore MRT system.
Paper Preview
Abstract
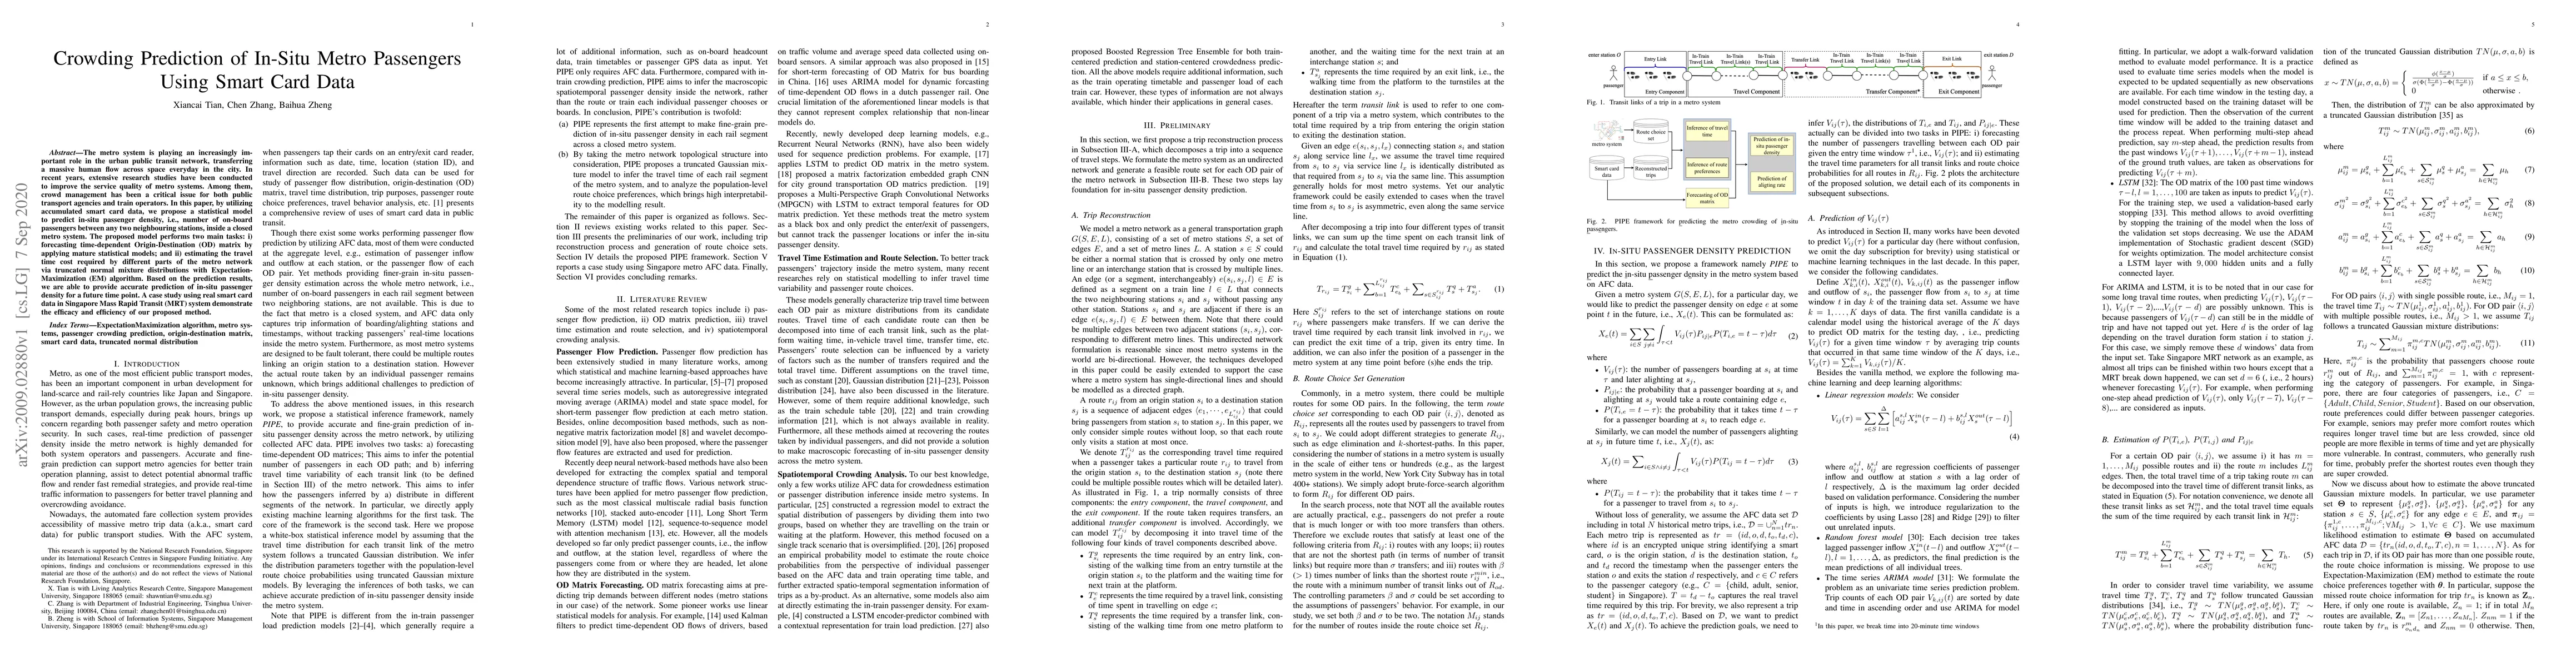
The metro system is playing an increasingly important role in the urban public transit network, transferring a massive human flow across space everyday in the city. In recent years, extensive research studies have been conducted to improve the service quality of metro systems. Among them, crowd management has been a critical issue for both public transport agencies and train operators. In this paper, by utilizing accumulated smart card data, we propose a statistical model to predict in-situ passenger density, i.e., number of on-board passengers between any two neighbouring stations, inside a closed metro system. The proposed model performs two main tasks: i) forecasting time-dependent Origin-Destination (OD) matrix by applying mature statistical models; and ii) estimating the travel time cost required by different parts of the metro network via truncated normal mixture distributions with Expectation-Maximization (EM) algorithm. Based on the prediction results, we are able to provide accurate prediction of in-situ passenger density for a future time point. A case study using real smart card data in Singapore Mass Rapid Transit (MRT) system demonstrate the efficacy and efficiency of our proposed method.
AI Key Findings
Get AI-generated insights about this paper's methodology, results, significance, and more — seven facets brought into focus.
Impact
Paper Details
Authors
PDF Preview
Key Terms
Citation Network
Current paper (gray), citations (green), references (blue)
Display is limited for performance on very large graphs.
Discussion 0