Crystallization and glass transition in supercooled binary Lennard-Jones liquids
Publication
Metrics
AI Quick Summary
This study reports the first observation of crystal growth in the supercooled Kob-Andersen binary Lennard-Jones mixtures via molecular simulation, with crystallization onset occurring at $T_c=0.55$ above the glass transition temperature $T_g=0.40$. The research also reveals distinct statistical distributions for crystallization and glass transition, with crystallization showing a power-law decay and glassy relaxation exhibiting dynamic heterogeneity.
Paper Preview
Abstract
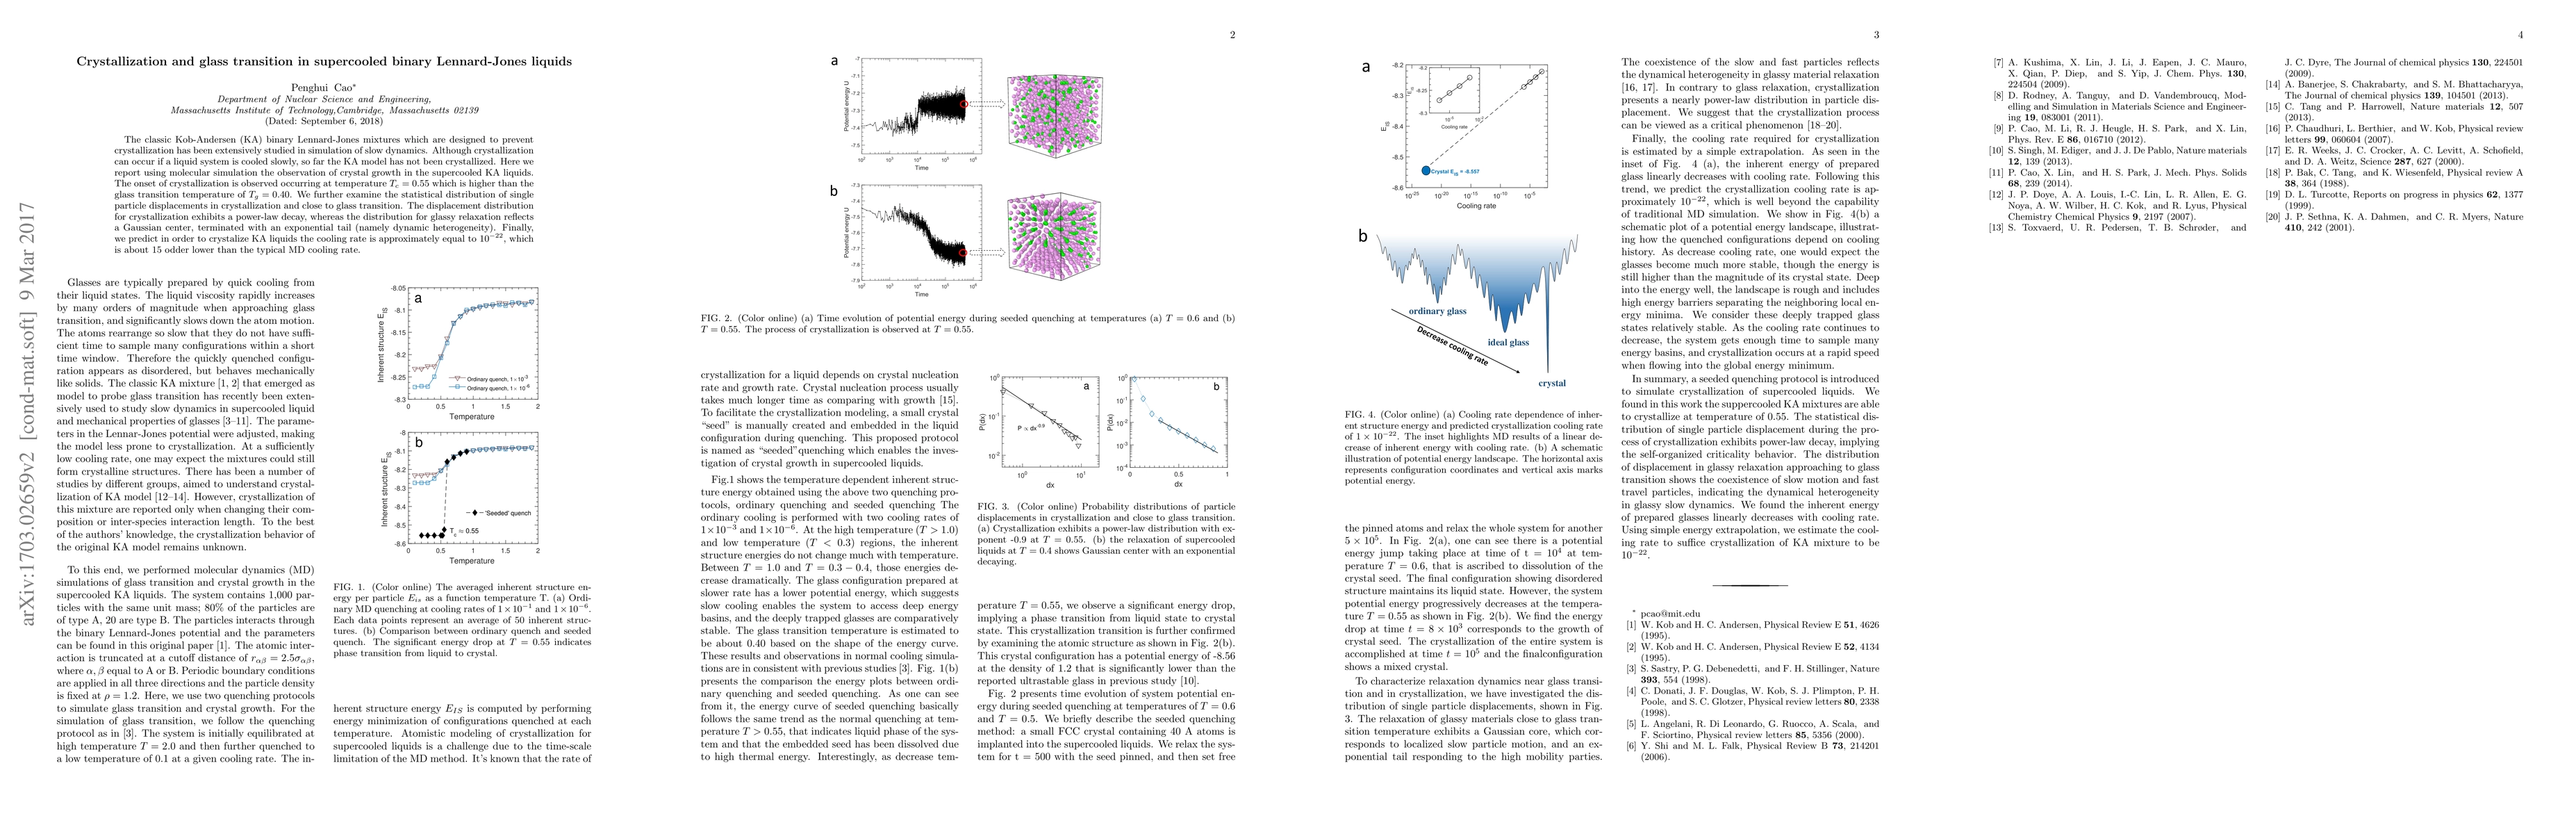
The classic Kob-Andersen (KA) binary Lennard-Jones mixtures which are designed to prevent crystallization has been extensively studied in simulation of slow dynamics. Although crystallization can occur if a liquid system is cooled slowly, so far the KA model has not been crystallized. Here we report using molecular simulation the observation of crystal growth in the supercooled KA liquids. The onset of crystallization is observed occurring at temperature $T_c= 0.55$ which is higher than the glass transition temperature of $T_g=0.40$. We further examine the statistical distribution of single particle displacements in crystallization and close to glass transition. The displacement distribution for crystallization exhibits a power-law decay, whereas the distribution for glassy relaxation reflects a Gaussian center, terminated with an exponential tail (namely dynamic heterogeneity). Finally, we predict in order to crystalize KA liquids the cooling rate is approximately equal to $10^{-22}$, which is about 15 odder lower than the typical MD cooling rate.
AI Key Findings
Get AI-generated insights about this paper's methodology, results, significance, and more — seven facets brought into focus.
Impact
Paper Details
PDF Preview
Key Terms
Citation Network
Current paper (gray), citations (green), references (blue)
Display is limited for performance on very large graphs.
Discussion 0