CWITools: A Python3 Data Analysis Pipeline for the Cosmic Web Imager Instruments
Publication
Metrics
AI Quick Summary
CWITools is a Python3-based data analysis pipeline designed for the Palomar and Keck Cosmic Web Imager instruments, facilitating the extraction of scientific data from their three-dimensional IFU outputs. It aims to streamline the analysis process for large survey datasets, providing tools for generating surface brightness maps, spectra, and velocity maps.
Paper Preview
Abstract
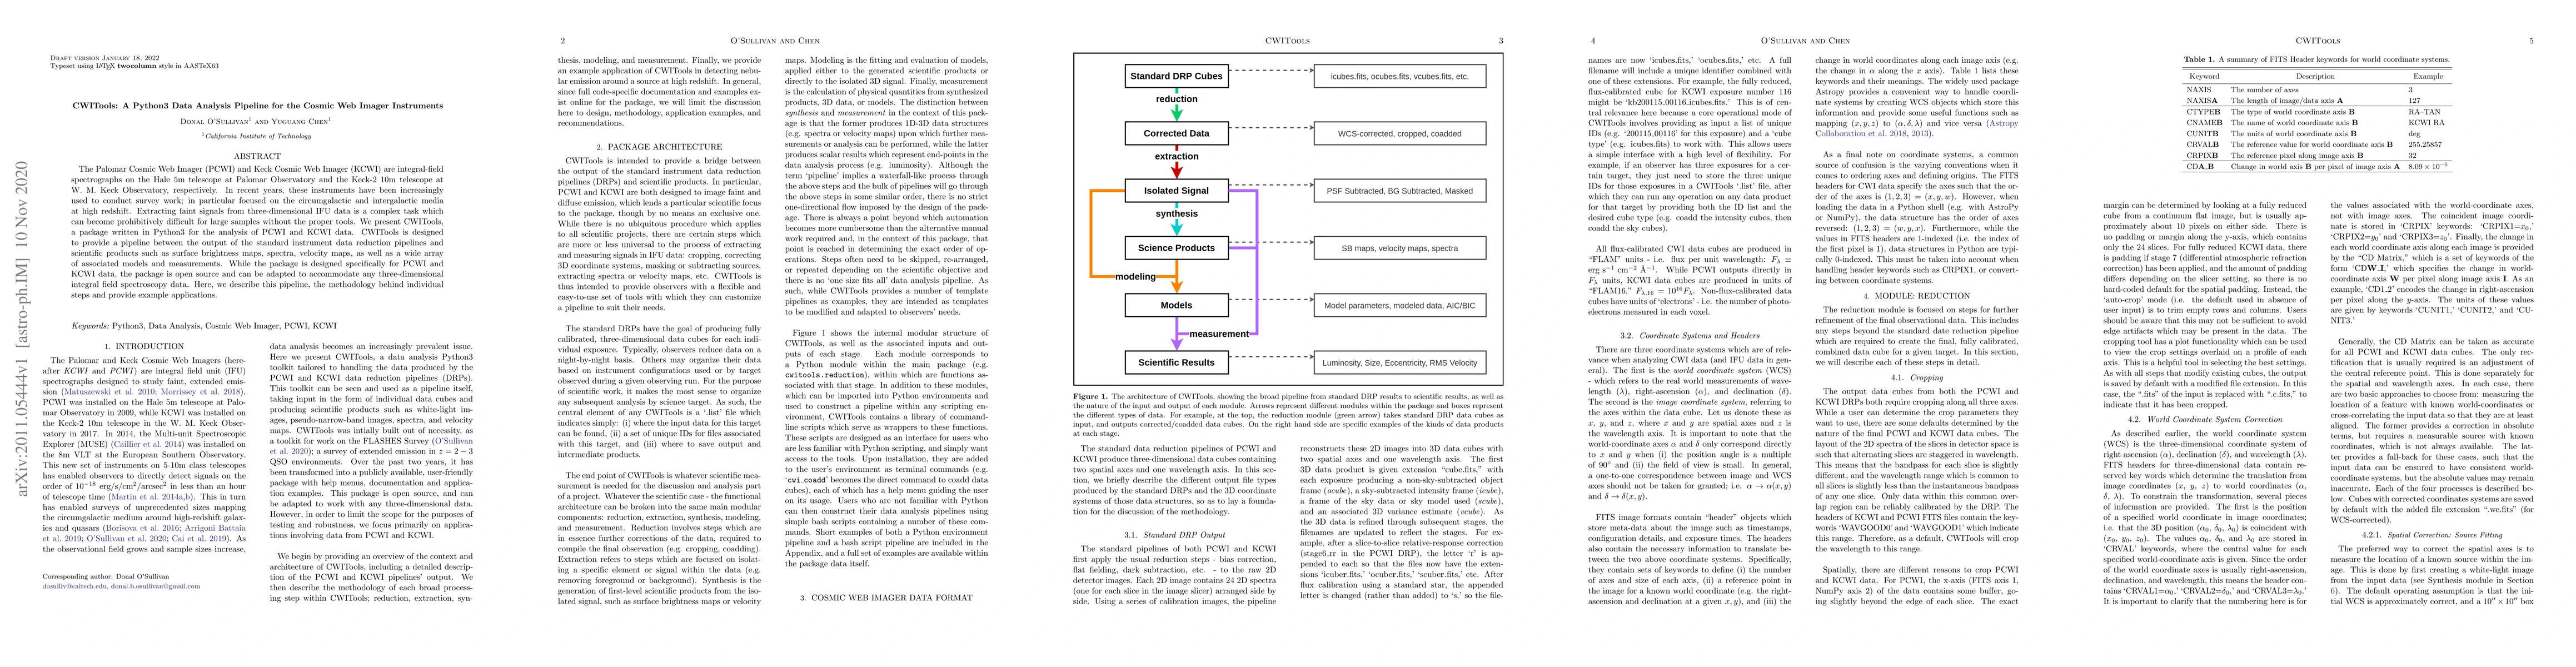
The Palomar Cosmic Web Imager (PCWI) and Keck Cosmic Web Imager (KCWI) are integral-field spectrographs on the Hale 5m telescope at Palomar Observatory and the Keck-2 10m telescope at W. M. Keck Observatory, respectively. In recent years, these instruments have been increasingly used to conduct survey work; in particular focused on the circumgalactic and intergalactic media at high redshift. Extracting faint signals from three-dimensional IFU data is a complex task which can become prohibitively difficult for large samples without the proper tools. We present CWITools, a package written in Python3 for the analysis of PCWI and KCWI data. CWITools is designed to provide a pipeline between the output of the standard instrument data reduction pipelines and scientific products such as surface brightness maps, spectra, velocity maps, as well as a wide array of associated models and measurements. While the package is designed specifically for PCWI and KCWI data, the package is open source and can be adapted to accommodate any three-dimensional integral field spectroscopy data. Here, we describe this pipeline, the methodology behind individual steps and provide example applications.
AI Key Findings
Get AI-generated insights about this paper's methodology, results, significance, and more — seven facets brought into focus.
Impact
Paper Details
Authors
PDF Preview
Key Terms
Citation Network
Current paper (gray), citations (green), references (blue)
Display is limited for performance on very large graphs.
Discussion 0