Summary
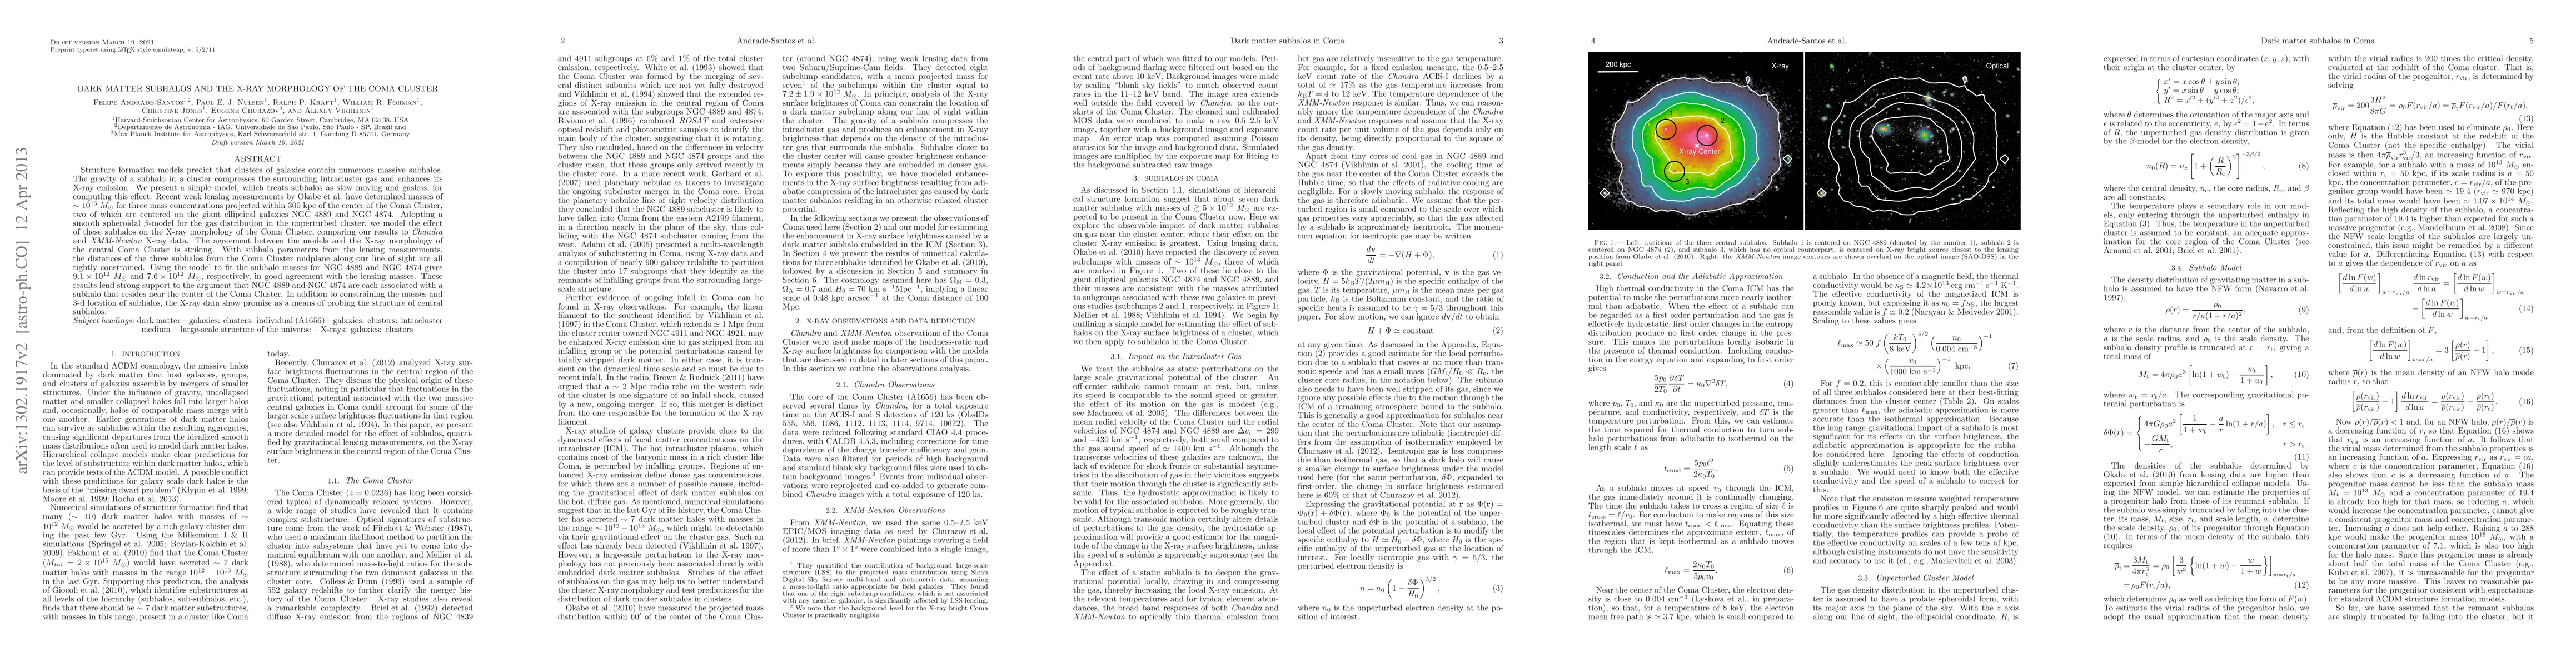
Structure formation models predict that clusters of galaxies contain numerous massive subhalos. The gravity of a subhalo in a cluster compresses the surrounding intracluster gas and enhances its X-ray emission. We present a simple model, which treats subhalos as slow moving and gasless, for computing this effect. Recent weak lensing measurements by Okabe et al. have determined masses of ~ 10^13 solar masses for three mass concentrations projected within 300 kpc of the center of the Coma Cluster, two of which are centered on the giant elliptical galaxies NGC 4889 and NGC 4874. Adopting a smooth spheroidal beta-model for the gas distribution in the unperturbed cluster, we model the effect of these subhalos on the X-ray morphology of the Coma Cluster, comparing our results to Chandra and XMM-Newton X-ray data. The agreement between the models and the X-ray morphology of the central Coma Cluster is striking. With subhalo parameters from the lensing measurements, the distances of the three subhalos from the Coma Cluster midplane along our line of sight are all tightly constrained. Using the model to fit the subhalo masses for NGC 4889 and NGC 4874 gives 9.1 x 10^12 and 7.6 x 10^12 solar masses, respectively, in good agreement with the lensing masses. These results lend strong support to the argument that NGC 4889 and NGC 4874 are each associated with a subhalo that resides near the center of the Coma Cluster. In addition to constraining the masses and 3-d location of subhalos, the X-ray data show promise as a means of probing the structure of central subhalos.
AI Key Findings
Get AI-generated insights about this paper's methodology, results, and significance.
Paper Details
PDF Preview
Key Terms
Citation Network
Current paper (gray), citations (green), references (blue)
Display is limited for performance on very large graphs.
Similar Papers
Found 4 papers| Title | Authors | Year | Actions |
|---|
Comments (0)