DASS Good: Explainable Data Mining of Spatial Cohort Data
Publication
Metrics
AI Quick Summary
The DASS system co-designed for hybrid human-machine development of predictive models estimates long-term toxicities in head and neck cancer patients from radiotherapy doses, leveraging spatial data and explainable AI. Feedback from oncology experts highlights the system's practical utility and design insights gained from the collaboration.
Paper Preview
Abstract
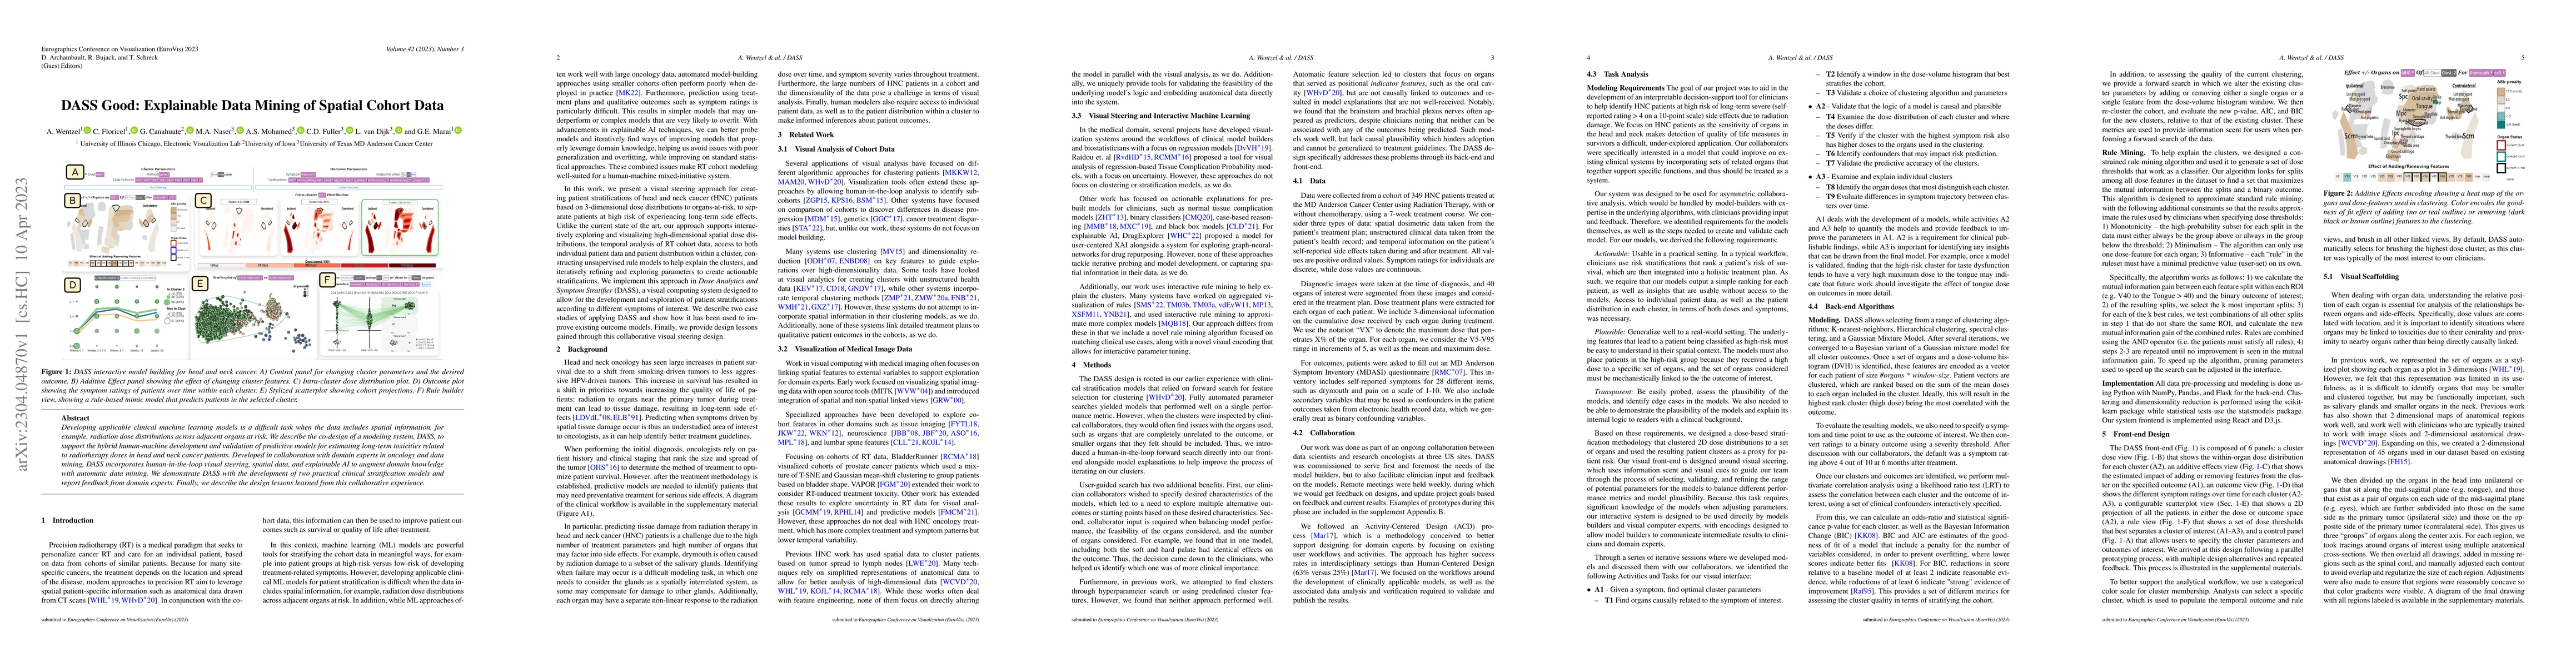
Developing applicable clinical machine learning models is a difficult task when the data includes spatial information, for example, radiation dose distributions across adjacent organs at risk. We describe the co-design of a modeling system, DASS, to support the hybrid human-machine development and validation of predictive models for estimating long-term toxicities related to radiotherapy doses in head and neck cancer patients. Developed in collaboration with domain experts in oncology and data mining, DASS incorporates human-in-the-loop visual steering, spatial data, and explainable AI to augment domain knowledge with automatic data mining. We demonstrate DASS with the development of two practical clinical stratification models and report feedback from domain experts. Finally, we describe the design lessons learned from this collaborative experience.
AI Key Findings
Get AI-generated insights about this paper's methodology, results, significance, and more — seven facets brought into focus.
Impact
Paper Details
Authors
PDF Preview
Key Terms
Citation Network
Current paper (gray), citations (green), references (blue)
Display is limited for performance on very large graphs.
Discussion 0