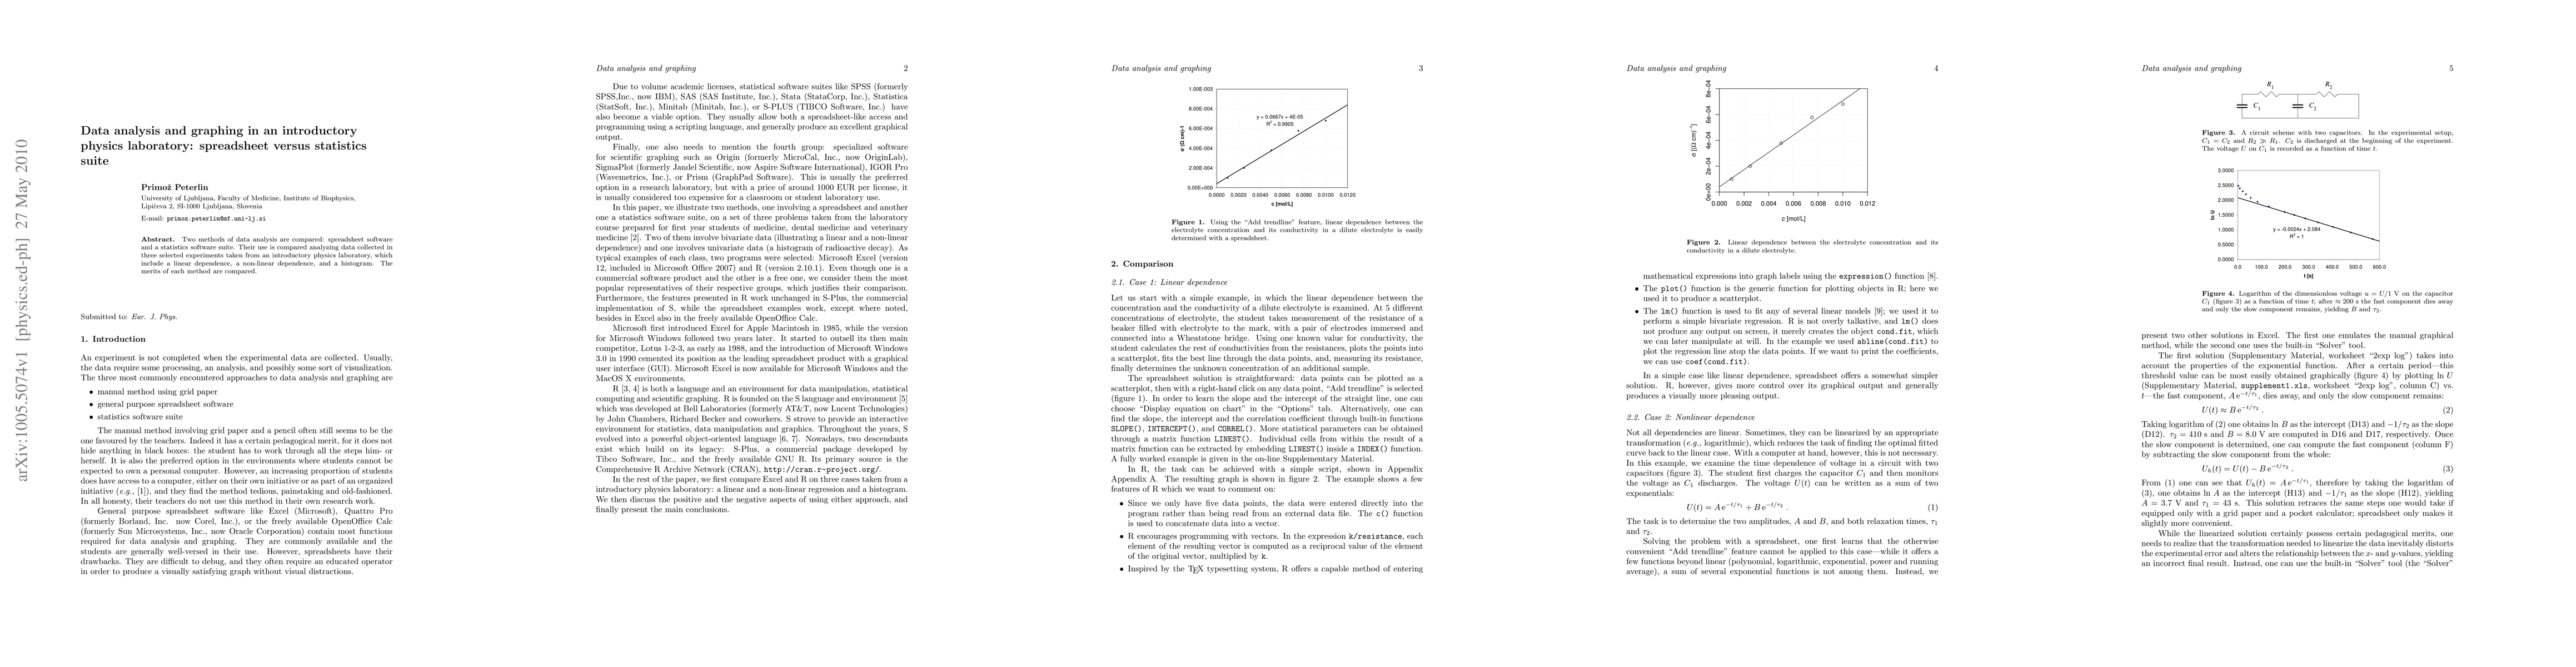
This paper compares the use of spreadsheet software and statistics suite software for data analysis in introductory physics labs, focusing on three experiments: linear dependence, non-linear dependence, and histograms, to evaluate the merits of each method.
Two methods of data analysis are compared: spreadsheet software and a statistics software suite. Their use is compared analyzing data collected in three selected experiments taken from an introductory physics laboratory, which include a linear dependence, a non-linear dependence, and a histogram. The merits of each method are compared.
This graph shows how this paper is connected to other research. The current paper is shown in dark gray, papers that cite it are in green, and papers it references are in blue. You can:
• Hover over any node to see the paper title
• Click a node to view that paper's details
• Drag nodes to rearrange the graph
• Use the zoom controls (bottom right) to zoom in/out
Title | Authors | Year | Actions |
---|---|---|---|
Event-driven kinematic measurements using BBC micro:bits programmed in C++
|
Anikó Somogyi, András Kelemen, J. Mellar, R. Mingesz
|
2024
|
View Paper |
Implementing the LSEESC Methodology with AI-Guided Support for Active Learning in Engineering Physics Courses
|
Erika Cervantes Juáres, Daniel Sánchez Guzmán
|
2024
|
View Paper |
Learning science and engineering with electronic spreadsheets cycle: a methodological proposal
|
Erika Cervantes Juárez, Daniel Sánchez Guzmán
|
2023
|
View Paper |
Evaluation of Extent of Computer Appreciation Skills Acquired by Secondary School Students for Economic Empowerment
|
P. Obichukwu, C. Olelewe, Peter Nwafor Igboamalu, C. Ugo, Abdulkadir Abdulrahman, O. Okanazu, Joshua Onyedikachi Ike, M. Abdullahi
|
2021
|
View Paper |
Teaching physics online through spreadsheets in a pandemic situation
|
M. Iqbal, Fayzan Ahmed, A. Iqbal, Z. Uddin
|
2020
|
View Paper |
Embedding online, design-focused data visualization instruction in an upper-division undergraduate atmospheric science course
|
KJ Hepworth, C. Ivey, Chelsea Canon, H. Holmes
|
2020
|
View Paper |
A user-friendly excel spreadsheet for dealing with spectroscopic and chromatographic data
|
Alan L. Vieira, Maurilio Gustavo Nespeca, W. D. Pavini, E. Ferreira, J. A. Neto
|
2019
|
View Paper |
Improving Science Students’ Data Visualizations: A STEAM-Based Approach
|
KJ Hepworth, Chelsea Canon
|
2018
|
View Paper |
What statistics can tell us about strategy in tennis
|
I. Y. Kawashima, O. Helene, M. Yamashita, R. S. M. D. Carvalho
|
2015
|
View Paper |
An Exploration of Graphing Software Program Selection and Relative Proficiency Among Undergraduate Biology Students
|
E. Ferguson
|
2014
|
View Paper |
The art of model fitting to experimental results
|
P. Sebastião
|
2013
|
View Paper |
Eugenio Tufino, Stefano Oss, Micol Alemani
Published: 2023-09-13
Published: 2014-01-15
Bilas Paul, Shantanu Chakraborty, Ganga Sharma
Published: 2024-05-27
Comments (0)