The paper identifies collaboration challenges between designers and developers in complex data visualization projects, emphasizing data-specific issues such as adapting to changing data and communicating data mappings. It proposes opportunities for future tools to enhance prototyping, testing, and collaborative communication for more successful visualization design.
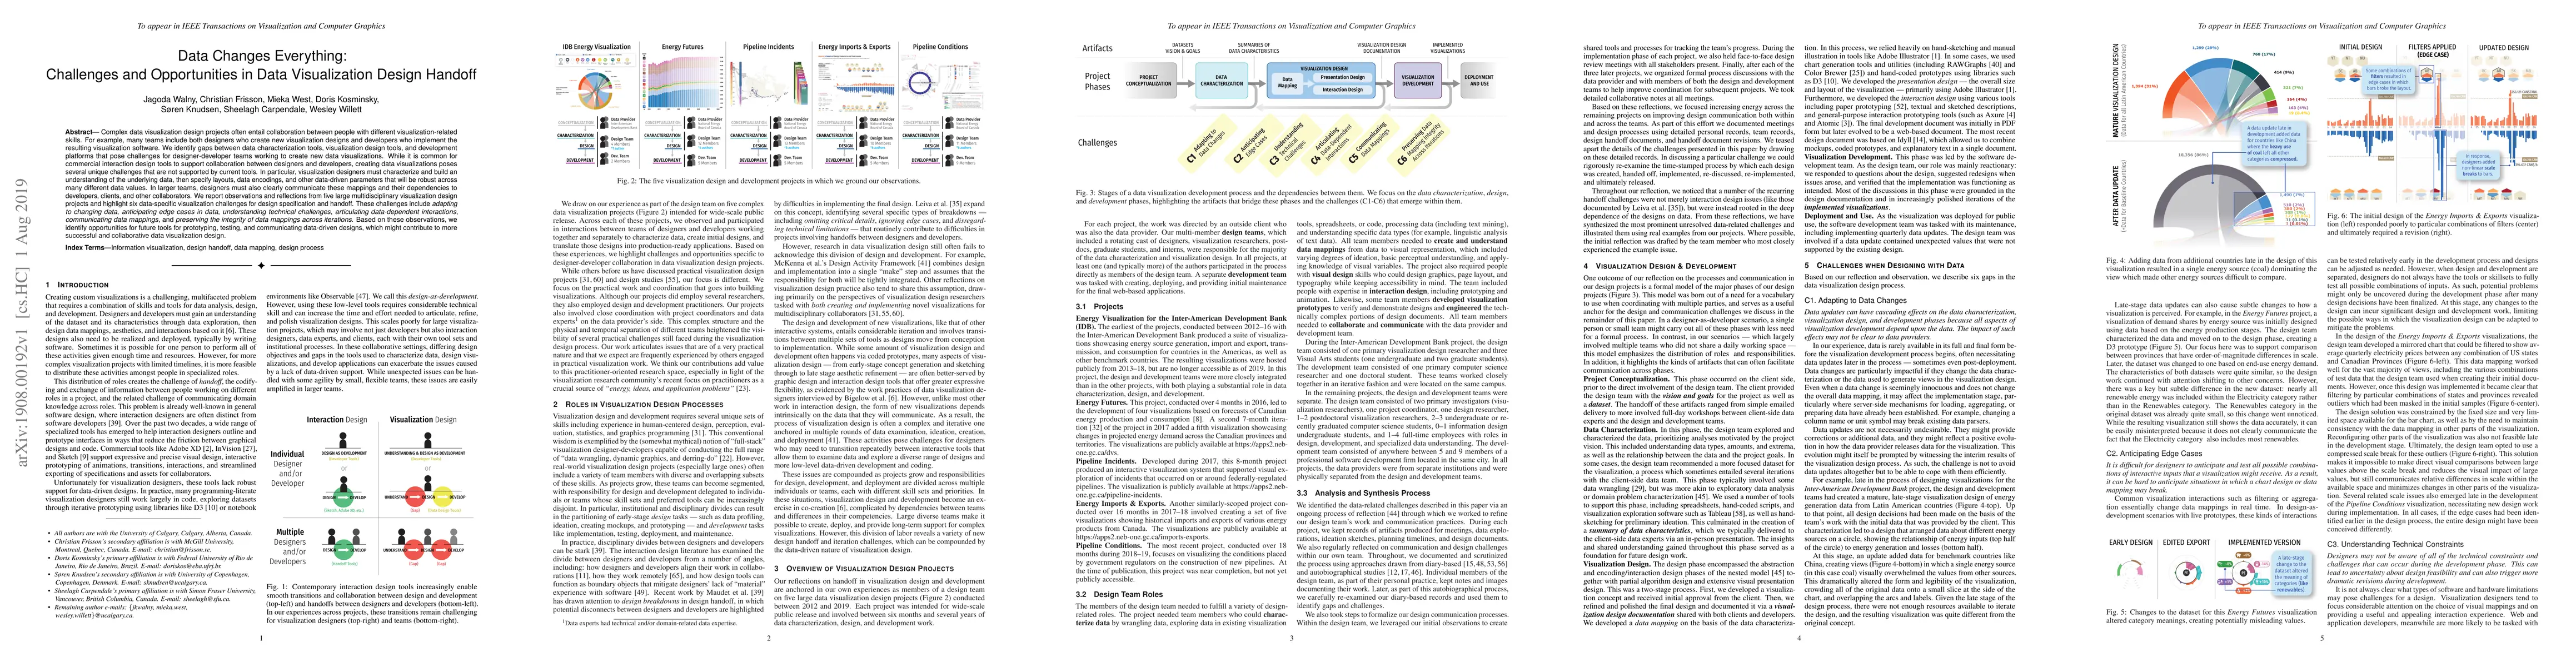
Complex data visualization design projects often entail collaboration between people with different visualization-related skills. For example, many teams include both designers who create new visualization designs and developers who implement the resulting visualization software. We identify gaps between data characterization tools, visualization design tools, and development platforms that pose challenges for designer-developer teams working to create new data visualizations. While it is common for commercial interaction design tools to support collaboration between designers and developers, creating data visualizations poses several unique challenges that are not supported by current tools. In particular, visualization designers must characterize and build an understanding of the underlying data, then specify layouts, data encodings, and other data-driven parameters that will be robust across many different data values. In larger teams, designers must also clearly communicate these mappings and their dependencies to developers, clients, and other collaborators. We report observations and reflections from five large multidisciplinary visualization design projects and highlight six data-specific visualization challenges for design specification and handoff. These challenges include adapting to changing data, anticipating edge cases in data, understanding technical challenges, articulating data-dependent interactions, communicating data mappings, and preserving the integrity of data mappings across iterations. Based on these observations, we identify opportunities for future tools for prototyping, testing, and communicating data-driven designs, which might contribute to more successful and collaborative data visualization design.
Get AI-generated insights about this paper's methodology, results, and significance.
Current paper (gray), citations (green), references (blue)
Fateme Rajabiyazdi, Shri Harini Ramesh
Fateme Rajabiyazdi, Wolfgang Aigner, Jan Aerts et al.
Yilin Xia, Bongshin Lee, JooYoung Seo et al.
Title | Authors | Year | Actions |
---|---|---|---|
An exploratory empirical eye-tracker study of visualization techniques for coverage of combinatorial interaction testing in software product lines
|
Kambiz Nezami Balouchi, Julien Mercier, R. Lopez-Herrejon
|
2025
|
View Paper |
Construction of Enterprise Human Resource Information Security Management Platform Based on Data Mining Algorithms
|
JinZhao Song
|
2024
|
View Paper |
The application and impact of artificial intelligence technology in graphic design: A critical interpretive synthesis
|
Hong Li, Tao Xue, Aijia Zhang, Xuexin Luo, Lingqi Kong, Guanghui Huang
|
2024
|
View Paper |
Unveiling How Examples Shape Visualization Design Outcomes
|
Hannah K. Bako, Xinyi Liu, Grace Ko, Hyemi Song, Leilani Battle, Zhicheng Liu
|
2024
|
View Paper |
VisUAM: A web-based tool for data visualization in scientific research
|
Adriana Pérez-Espinosa, Manuel Aguilar Cornejo, L. Dagdug, J. L. Quiroz-Fabián, G. Román-Alonso, M. Castro-García
|
2024
|
View Paper |
Designing the Australian Cancer Atlas: visualizing geostatistical model uncertainty for multiple audiences
|
Sarah Goodwin, Thom Saunders, Joanne Aitken, P. Baade, Upeksha Chandrasiri, Dianne Cook, S. Cramb, Earl Duncan, Stephanie Kobakian, Jessie Roberts, Kerrie L. Mengersen
|
2024
|
View Paper |
A framework to improve causal inferences from visualizations using counterfactual operators
|
Arran Zeyu Wang, D. Borland, David Gotz
|
2024
|
View Paper |
“It's a Good Idea to Put It Into Words”: Writing ‘Rudders’ in the Initial Stages of Visualization Design
|
Chase Stokes, Clara Hu, Marti A. Hearst
|
2024
|
View Paper |
“I Came Across a Junk”: Understanding Design Flaws of Data Visualization from the Public's Perspective
|
Xingyu Lan, Yu Liu
|
2024
|
View Paper |
Constraint-Based Breakpoints for Responsive Visualization Design and Development
|
Sarah Schöttler, J. Dykes, Jo Wood, Uta Hinrichs, Benjamin Bach
|
2024
|
View Paper |
Enhancing Mobile Visualisation Interactivity: Insights on a Mixed-fidelity Prototyping Approach
|
Fabiola Polidoro, Yu Liu, Paul Craig
|
2024
|
View Paper |
CAWAL: A novel unified analytics framework for enterprise web applications and multi-server environments
|
Ozkan Canay, Ümit Kocabıçak
|
2024
|
View Paper |
Requirements Elicitation in Government Projects: A Preliminary Empirical Study
|
Anqi Ren, Lin Liu, Yi Wang, Xiao Liu, Hailong Wang, Kaijia Xu, Xishuo Zhang, Chetan Arora
|
2024
|
View Paper |
Enhancing Accessibility and Navigation of Heritage Collections Through Interactive Spatiotemporal Maps
|
P. Casanova-Salas, Javier Sevilla, Inmaculada Coma, Pedro Morillo, Mar Gaitán, C. Portalés
|
2024
|
View Paper |
Data visualization guidance using a software product line approach
|
David Romero-Organvidez, J. Horcas, J. Galindo, David Benavides
|
2024
|
View Paper |
War, Torture and Trauma in Preadolescents from Gaza Strip. Two Different Modalities of PTSD
|
A. Manzanero, J. Aróztegui, Juan Fernández, Marta Guarch-Rubio, M. Álvarez, Sofián El-Astal, Fairouz Hemaid
|
2024
|
View Paper |
An empirical study of counterfactual visualization to support visual causal inference
|
Arran Zeyu Wang, D. Borland, David Gotz
|
2024
|
View Paper |
The Easy Design Handoff Plugin and a CI/CD Pipeline for Automated Design Handoff
|
Jordan S. Queiroz, Mateus V. L. Arbex, Thiago A. Falcão, Phillip M. Furtado, Fabrício L. Soares, T. B. F. Souza, Barbara A. T. Silva, E. Bezerra
|
2023
|
View Paper |
NetPanorama: A Declarative Grammar for Network Construction, Transformation, and Visualization
|
James Scott-Brown, Benjamin Bach
|
2023
|
View Paper |
Preparing Future Data Visualization Designers for Professional Practice
|
Paul Parsons
|
2023
|
View Paper |
A Comprehensive Analysis of the Role of Artificial Intelligence and Machine Learning in Modern Digital Forensics and Incident Response
|
Dipo Dunsin, Mohamed Chahine Ghanem, K. Ouazzane, Vassil T. Vassilev
|
2023
|
View Paper |
Mystique: Deconstructing SVG Charts for Layout Reuse
|
Chen Chen, Bongshin Lee, Yunhai Wang, Yunjeong Chang, Z. Liu
|
2023
|
View Paper |
Contributions of remote collaborative sketching to the design of infovis in public health
|
L. Velloso, Mailson Fontes de Carvalho, Gabriela Momberg Araújo, Johne Marcus Jarske, Luciano Anísio Garcia, Luiz Sérgio de Souza, Marcia Ito, Solange Nice Alves-Souza, Tânia Letícia dos Santos, Henrique Mathias Fernandes, Lucia Vilela Leite Filgueiras
|
2023
|
View Paper |
Data Abstraction Elephants: The Initial Diversity of Data Representations and Mental Models
|
Katy Williams, Alex Bigelow, Katherine E. Isaacs
|
2023
|
View Paper |
An Empirical Guide for Visualization Consistency in Multiple Coordinated Views
|
Shaocong Tan, Chufan Lai, X. Zhang, Xiaoru Yuan
|
2023
|
View Paper |
A Problem Space for Designing Visualizations
|
Michael Gleicher, M. Riveiro, T. V. Landesberger, O. Deussen, Remco Chang, Christina Gillman
|
2023
|
View Paper |
Understanding Collaborative Practices and Tools of Professional UX Practitioners in Software Organizations
|
K. J. Kevin Feng, Tony W. Li, Amy X. Zhang
|
2023
|
View Paper |
A Qualitative Interview Study of Distributed Tracing Visualisation: A Characterisation of Challenges and Opportunities
|
Thomas Davidson, Emily Wall, Jonathan Mace
|
2023
|
View Paper |
Enterprise hierarchical management based on neural network model
|
P. Wang, Hua Bu
|
2023
|
View Paper |
Cinematic Techniques in Narrative Visualization
|
Matthew Conlen, Jeffrey Heer, H. Mushkin, Scott Davidoff
|
2023
|
View Paper |
Research on application of dynamic adaptive cache strategy and artificial intelligence technology in power engineering data processing
|
Xiaoling Tang
|
2022
|
View Paper |
Ten simple rules for developing visualization tools in genomics
|
Éloi Durant, M. Rouard, E. Ganko, Cédric Muller, Alan M. Cleary, A. Farmer, Matthieu G. Conte, F. Sabot
|
2022
|
View Paper |
Understanding how Designers Find and Use Data Visualization Examples
|
Hannah K. Bako, Xinyi Liu, L. Battle, Zhicheng Liu
|
2022
|
View Paper |
Understanding Barriers to Network Exploration with Visualization: A Report from the Trenches
|
Mashael AlKadi, Vanessa Serrano, James Scott-Brown, C. Plaisant, Jean-Daniel Fekete, Uta Hinrichs, B. Bach
|
2022
|
View Paper |
Variability in data visualization: a software product line approach
|
J. Horcas, J. Galindo, David Benavides
|
2022
|
View Paper |
Visualization Design Practices in a Crisis: Behind the Scenes with COVID-19 Dashboard Creators
|
Yixuan Zhang, Yifan Sun, Joseph D. Gaggiano, Neha Kumar, Clio Andris, Andrea G. Parker
|
2022
|
View Paper |
Exploration on the Optimal Application of Mobile Cloud Computing in Enterprise Financial Management under 5G Network Architecture
|
Yanlin Guo, Huwei Li
|
2022
|
View Paper |
FAIR and Interactive Data Graphics from a Scientific Knowledge Graph
|
Michael E. Deagen, Jamie McCusker, Tolulomo Fateye, Samuel Stouffer, L. Brinson, D. McGuinness, L. Schadler
|
2022
|
View Paper |
The Construction of the Development Mode of School-Enterprise Cooperation in Higher Vocational Education with the Aid of Sensitive Neural Network
|
Xiangbin Hu, A. Tan, Yan Gao
|
2022
|
View Paper |
Political affiliation moderates subjective interpretations of COVID-19 graphs
|
Jonathan D. Ericson, William S. Albert, Jacob Duane
|
2022
|
View Paper |
User-Driven Support for Visualization Prototyping in D3
|
Hannah K. Bako, Alisha Varma, Anuoluwapo Faboro, Mahreen Haider, Favour Nerrise, B. Kenah, John P. Dickerson, L. Battle
|
2021
|
View Paper |
Primary science curriculum student acceptance of blended learning: structural equation modeling and visual analytics
|
Xu Liu
|
2021
|
View Paper |
Linked visualisations via Galois dependencies
|
Roly Perera, Minh Nguyen, T. Petříček, M. Wang
|
2021
|
View Paper |
Understanding Data Visualization Design Practice
|
Paul C. Parsons
|
2021
|
View Paper |
Fixation and Creativity in Data Visualization Design: Experiences and Perspectives of Practitioners
|
Paul C. Parsons, P. Shukla, Chorong Park
|
2021
|
View Paper |
Lumiphys: Designing a Long-Term Energy Physicalization to Democratize Smart Campus Data
|
Luiz Augusto Morais, L. Sampaio, Gibran Yásser, Andrey Brito
|
2021
|
View Paper |
Towards A Process Model for Co-Creating AI Experiences
|
Hariharan Subramonyam, C. Seifert, Eytan Adar
|
2021
|
View Paper |
Visual Companion for Booklovers
|
Zona Kostic, Jared Jessup, Jeffrey Baglioni, Nathan Weeks, Johann Philipp Dreessen, Ning Chen, Tianyu Liu
|
2020
|
View Paper |
Uplift: A Tangible and Immersive Tabletop System for Casual Collaborative Visual Analytics
|
Barrett Ens, Sarah Goodwin, Arnaud Prouzeau, Fraser Anderson, F. Wang, S. Gratzl, Zac Lucarelli, Brendan Moyle, J. Smiley, Tim Dwyer
|
2020
|
View Paper |
VIDEM 2020: Workshop on Visual Interface Design Methods
|
Mandy Keck, D. Kammer, Alfredo Ferreira, Andrea Giachetti, Rainer Groh
|
2020
|
View Paper |
Data Badges: Making an Academic Profile Through a DIY Wearable Physicalization
|
Georgia Panagiotidou, Sinem Görücü, A. Moere
|
2020
|
View Paper |
Design Judgment in Data Visualization Practice
|
Paul C. Parsons, Colin M. Gray, Ali Baigelenov, Ian Carr
|
2020
|
View Paper |
Data Visualization Practitioners’ Perspectives on Chartjunk
|
Paul C. Parsons, P. Shukla
|
2020
|
View Paper |
Distributed Synchronous Visualization Design: Challenges and Strategies
|
Tatiana Losev, Sarah Storteboom, Sheelagh Carpendale, S. Knudsen
|
2020
|
View Paper |
MobileVisFixer: Tailoring Web Visualizations for Mobile Phones Leveraging an Explainable Reinforcement Learning Framework
|
Aoyu Wu, Wai-Shun Tong, Tim Dwyer, Bongshin Lee, Petra Isenberg, Huamin Qu
|
2020
|
View Paper |
"DRAWING WITH CODE": THE EXPERIENCE OF TEACHING CREATIVE CODING AS A SKILL FOR COMMUNICATION DESIGNERS
|
A. Benedetti, Tommaso Elli, Michele Mauri
|
2020
|
View Paper |
Guidelines For Pursuing and Revealing Data Abstractions
|
Alex Bigelow, Katy Williams, Kate Isaacs
|
2020
|
View Paper |
Design Exposition Discussion Documents for Rich Design Discourse in Applied Visualization
|
R. Beecham, J. Dykes, C. Rooney, W. Wong
|
2020
|
View Paper |
A Review on Data Terminology in Visual Analytics Tools
|
Johanna Schmidt, Milena Vuckovic
|
2024
|
View Paper |
User-Driven Support for Rapid Visualization Prototyping in D3
|
Hannah K. Bako, Alisha Varma, Anuoluwapo Faboro, Mahreen Haider, Favour Nerrise, B. Kenah, John P. Dickerson, L. Battle
|
2023
|
View Paper |
EMPOWERING WOMEN IN PLACE
|
M. Dolores, Pitarch Garrido, Félix Fajardo Magraner, María Dolores Pitarch Garrido, Félix Fajardo Magraner, Dolores Pitarch, Félix Fajardo
|
2023
|
View Paper |
The impact of visualizing operational deviations on overall quality in assembly lines
|
Ebly Sanchez, Axel Joelsson, M. Baumgartner, K. Åkesson
|
2022
|
View Paper |
Data Clutter Reduction in Sampling Technique
|
Nur Nina Manarina Jamalludin, Z. Idrus, Zanariah Idrus, A. A. Ahmarofi, Jahaya Abdul Hamid, Nurul Husna Mahadzir
|
2022
|
View Paper |
Improving Data Visualization Skills: A Curriculum Design
|
D. Asamoah
|
2022
|
View Paper |
Analyzing the Feasibility of Generating Data Visualizations from Hand-drawn Sketches Using Deep Learning
|
2021
|
View Paper | |
Visual Data Story Protocol: Internal Communications from Domain Expertise to Narrative Visualization Implementation
|
Apiwan Duangphummet, Puripant Ruchikachorn
|
2021
|
View Paper |
The VisTools Marketplace: An Activity to Understand the Landscape of Visualisation Tools
|
Arran L. Ridley, Sarah, Aba-Sah Dadzie, Benjamin Bach
|
2020
|
View Paper |
Comments (0)