Summary
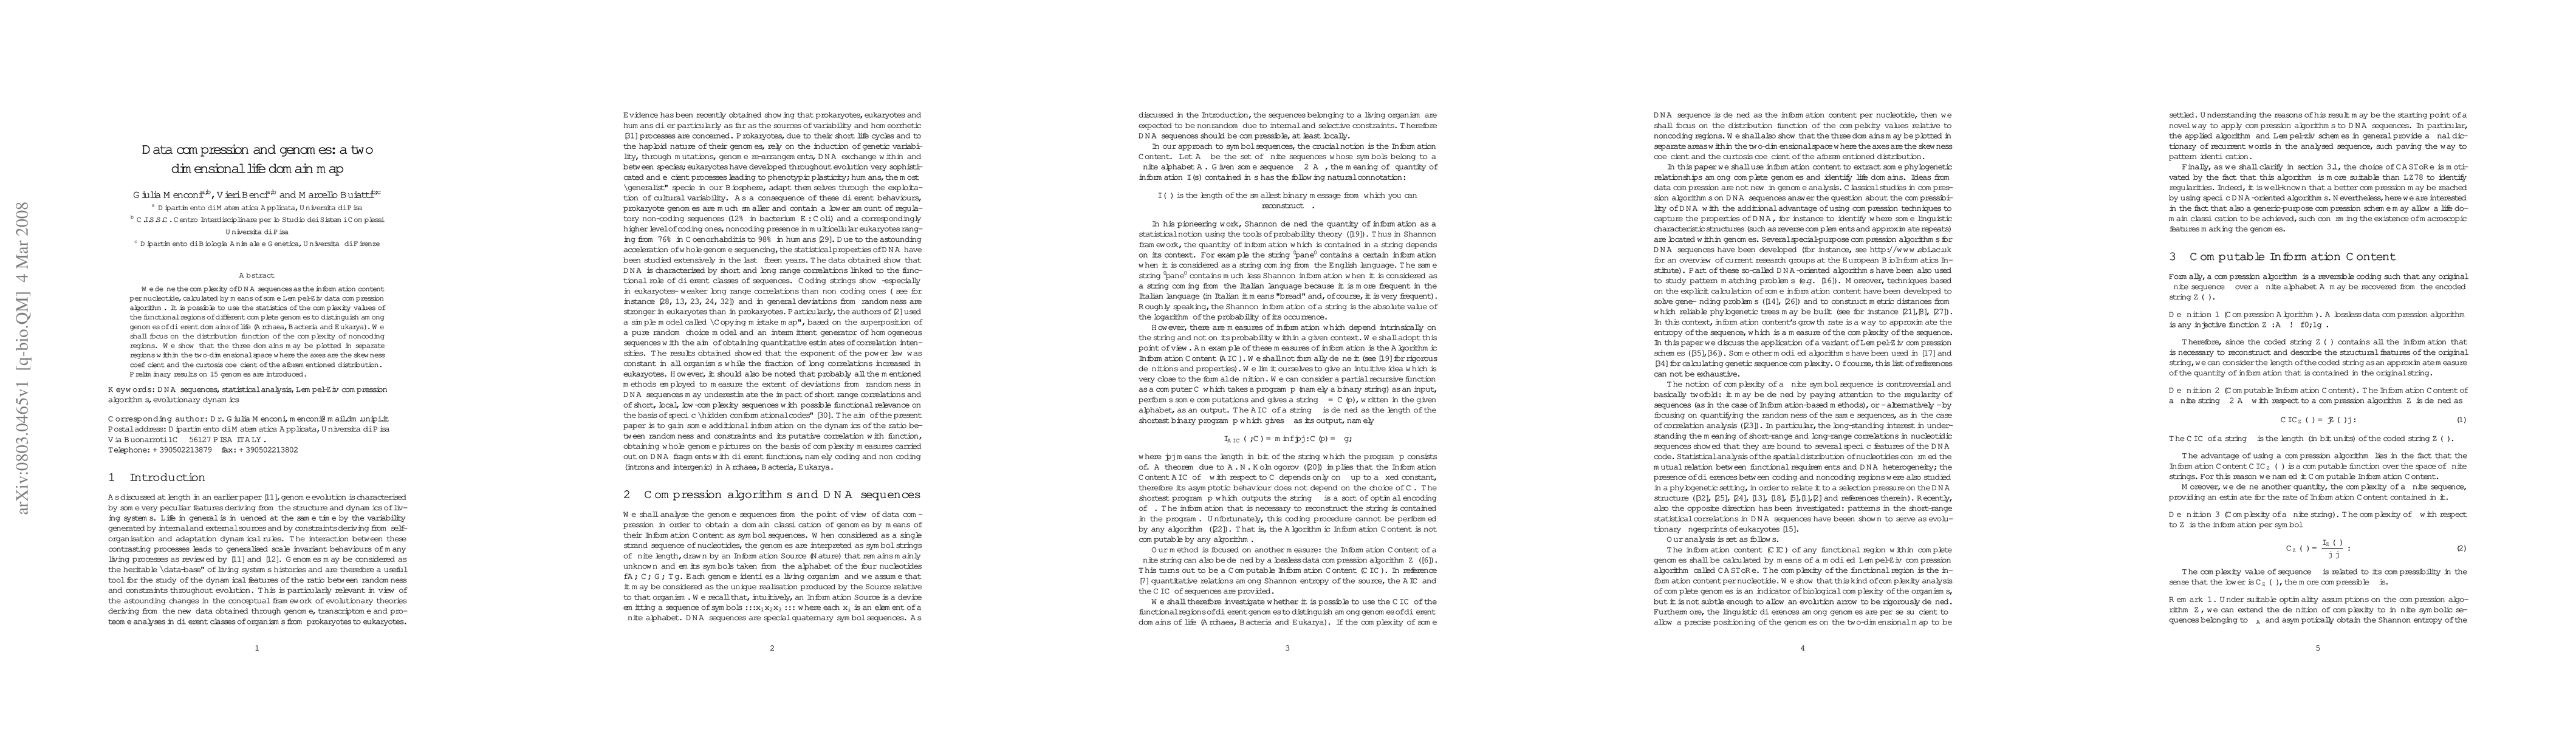
We define the complexity of DNA sequences as the information content per nucleotide, calculated by means of some Lempel-Ziv data compression algorithm. It is possible to use the statistics of the complexity values of the functional regions of different complete genomes to distinguish among genomes of different domains of life (Archaea, Bacteria and Eukarya). We shall focus on the distribution function of the complexity of noncoding regions. We show that the three domains may be plotted in separate regions within the two-dimensional space where the axes are the skewness coefficient and the curtosis coefficient of the aforementioned distribution. Preliminary results on 15 genomes are introduced.
AI Key Findings
Get AI-generated insights about this paper's methodology, results, and significance.
Paper Details
PDF Preview
Key Terms
Citation Network
Current paper (gray), citations (green), references (blue)
Display is limited for performance on very large graphs.
Similar Papers
Found 4 papersFunctional optimal transport: map estimation and domain adaptation for functional data
Ding Zhao, Jiacheng Zhu, Mengdi Xu et al.
| Title | Authors | Year | Actions |
|---|
Comments (0)