Authors
Summary
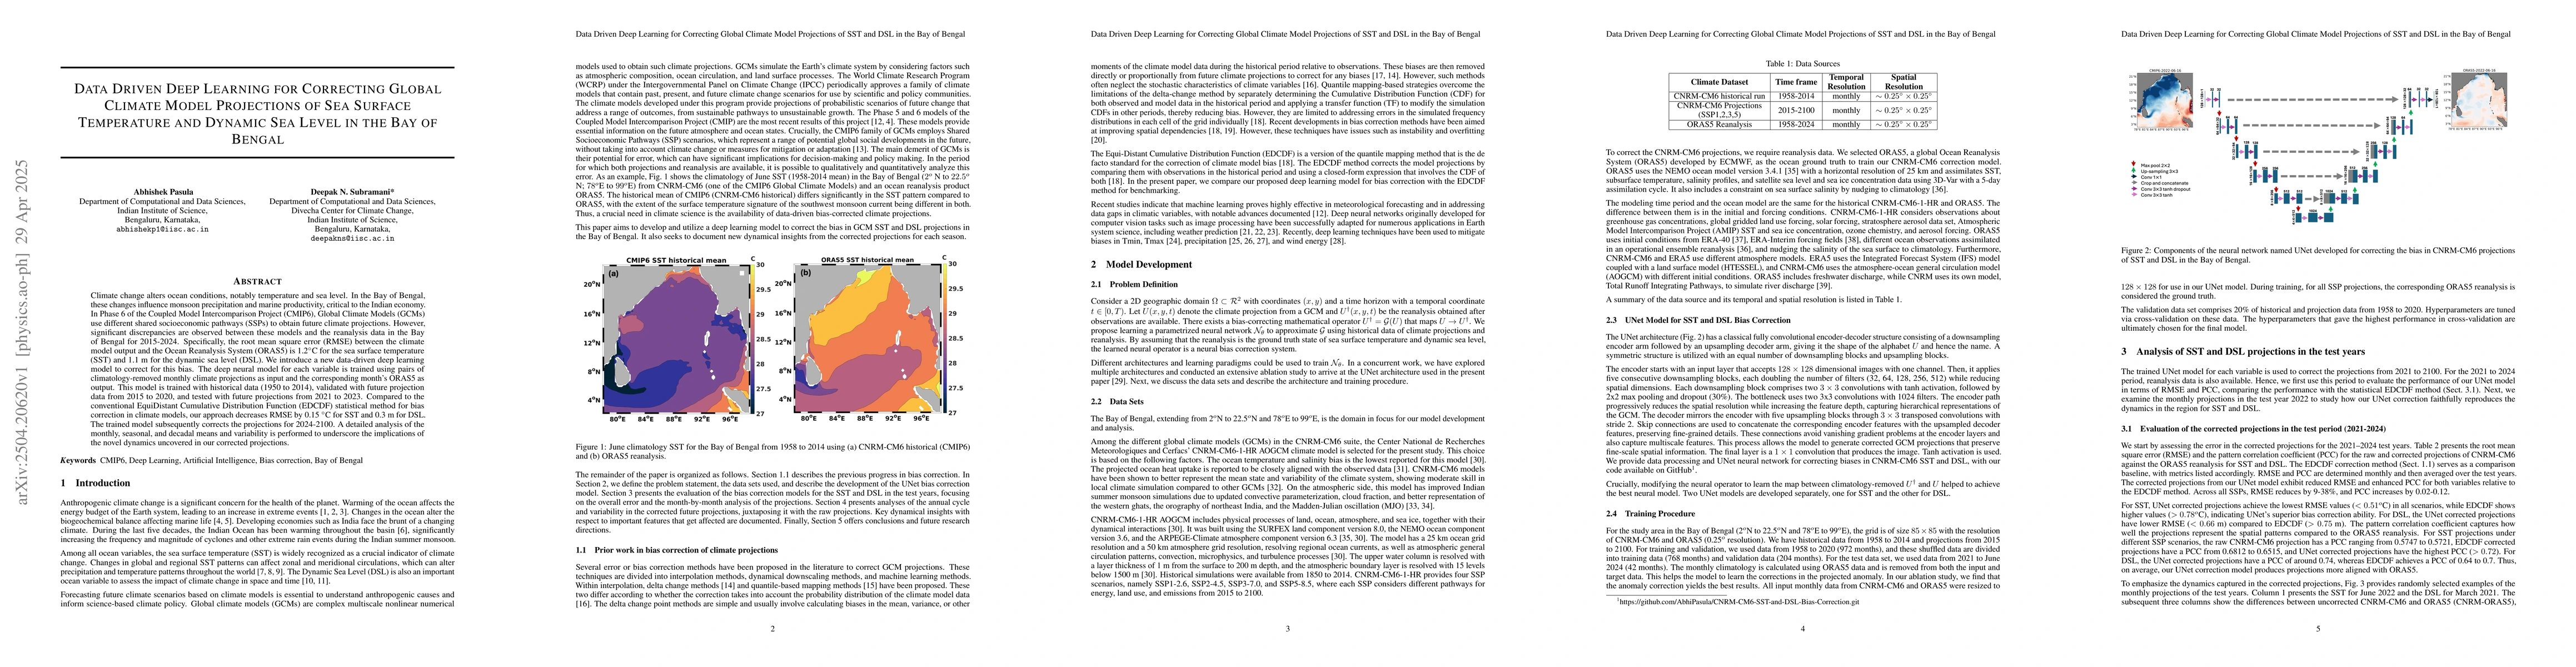
Climate change alters ocean conditions, notably temperature and sea level. In the Bay of Bengal, these changes influence monsoon precipitation and marine productivity, critical to the Indian economy. In Phase 6 of the Coupled Model Intercomparison Project (CMIP6), Global Climate Models (GCMs) use different shared socioeconomic pathways (SSPs) to obtain future climate projections. However, significant discrepancies are observed between these models and the reanalysis data in the Bay of Bengal for 2015-2024. Specifically, the root mean square error (RMSE) between the climate model output and the Ocean Reanalysis System (ORAS5) is 1.2C for the sea surface temperature (SST) and 1.1 m for the dynamic sea level (DSL). We introduce a new data-driven deep learning model to correct for this bias. The deep neural model for each variable is trained using pairs of climatology-removed monthly climate projections as input and the corresponding month's ORAS5 as output. This model is trained with historical data (1950 to 2014), validated with future projection data from 2015 to 2020, and tested with future projections from 2021 to 2023. Compared to the conventional EquiDistant Cumulative Distribution Function (EDCDF) statistical method for bias correction in climate models, our approach decreases RMSE by 0.15C for SST and 0.3 m for DSL. The trained model subsequently corrects the projections for 2024-2100. A detailed analysis of the monthly, seasonal, and decadal means and variability is performed to underscore the implications of the novel dynamics uncovered in our corrected projections.
AI Key Findings
Generated Jun 08, 2025
Methodology
A deep learning model is developed using pairs of climatology-removed monthly climate projections as input and corresponding month's ORAS5 data as output. The model is trained with historical data (1950-2014), validated with future projections (2015-2020), and tested with future projections (2021-2023).
Key Results
- The deep learning model decreases RMSE by 0.15°C for SST and 0.3 m for DSL compared to the conventional EDCDF statistical method.
- The model corrects projections for 2024-2100 in the Bay of Bengal.
- Detailed analysis of monthly, seasonal, and decadal means and variability is performed to highlight the implications of the corrected projections.
Significance
This research is crucial for accurately projecting climate change impacts on the Bay of Bengal, which significantly affects the Indian monsoon and marine productivity, thus having substantial socioeconomic implications.
Technical Contribution
The introduction of a data-driven deep learning model for bias correction in climate model projections, outperforming traditional statistical methods.
Novelty
The novelty lies in employing deep learning techniques to correct GCM projection biases, providing improved accuracy for critical climate variables like SST and DSL in the Bay of Bengal.
Limitations
- The model's performance outside the tested period (2021-2023) remains unverified.
- Model's applicability to other regions beyond the Bay of Bengal is uncertain.
Future Work
- Extending the model to other ocean basins for broader applicability.
- Investigating the model's performance and robustness for longer-term projections beyond 2100.
Paper Details
PDF Preview
Similar Papers
Found 4 papersGlobal Climate Model Bias Correction Using Deep Learning
Deepak N. Subramani, Abhishek Pasula
Regional modeling of surface and sub-surface dynamics in the Bay of Bengal using Modular Ocean Model
Are Deep Learning Methods Suitable for Downscaling Global Climate Projections? Review and Intercomparison of Existing Models
Jose González-Abad, José Manuel Gutiérrez
No citations found for this paper.
Comments (0)