Data-driven quantification and visualization of resilience metrics of power distribution system
Publication
Metrics
Paper Preview
Abstract
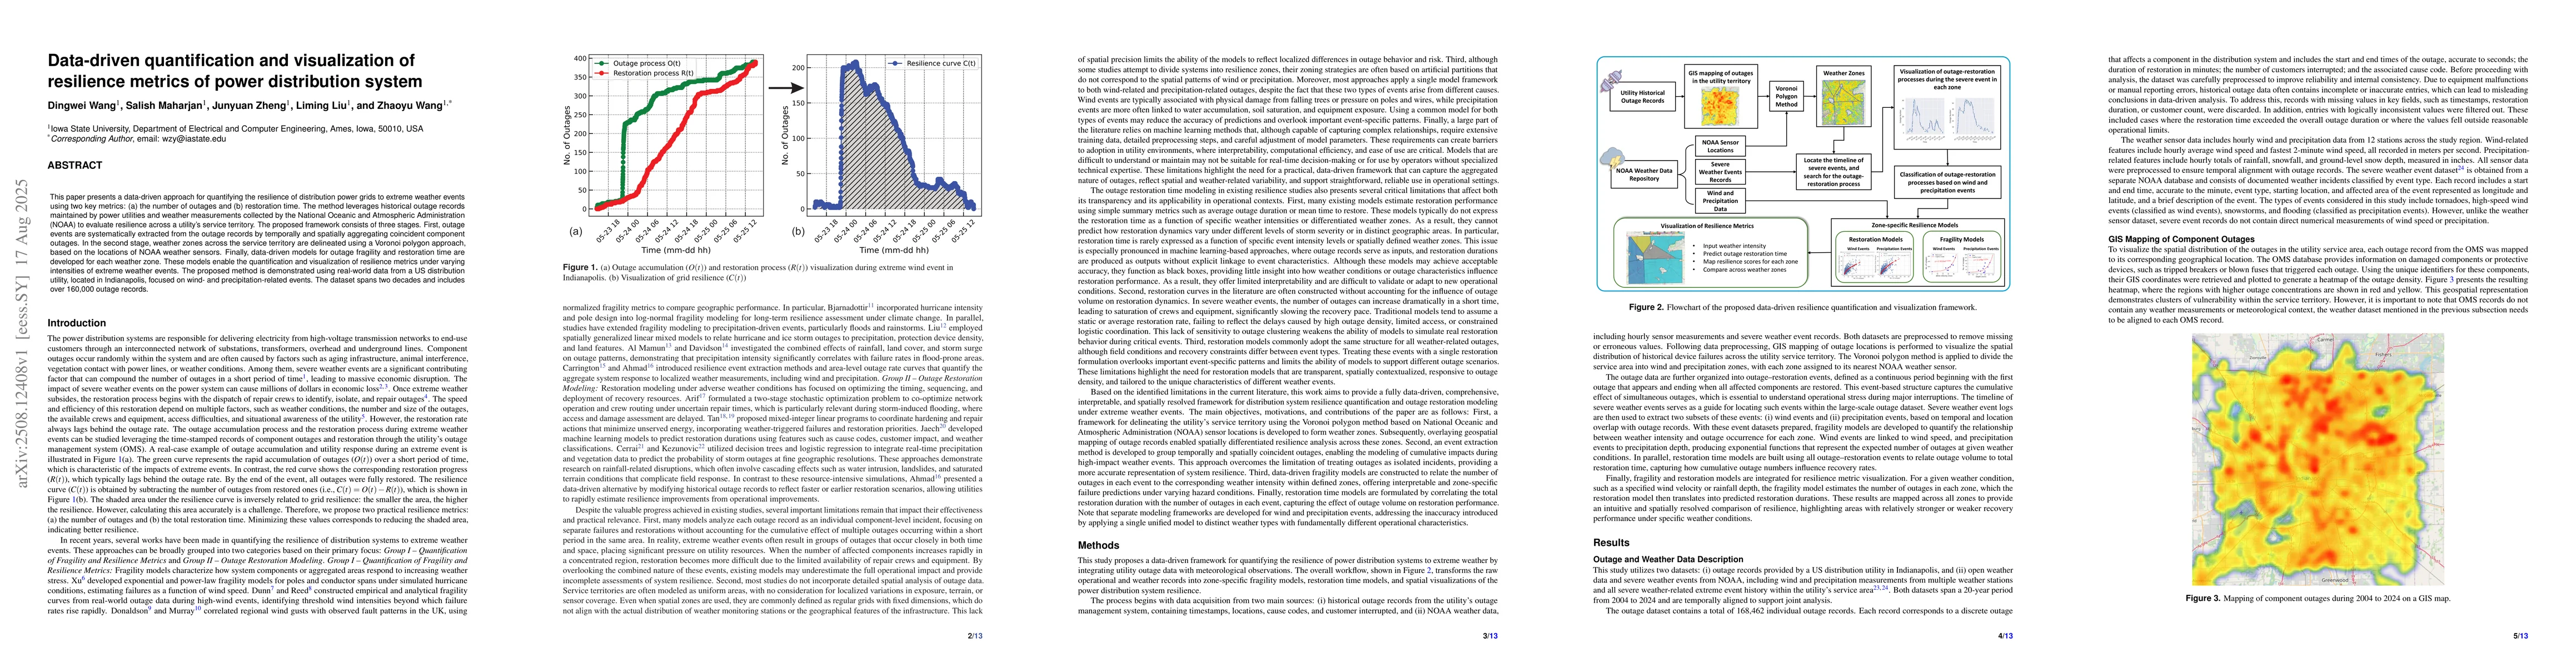
This paper presents a data-driven approach for quantifying the resilience of distribution power grids to extreme weather events using two key metrics: (a) the number of outages and (b) restoration time. The method leverages historical outage records maintained by power utilities and weather measurements collected by the National Oceanic and Atmospheric Administration (NOAA) to evaluate resilience across a utility's service territory. The proposed framework consists of three stages. First, outage events are systematically extracted from the outage records by temporally and spatially aggregating coincident component outages. In the second stage, weather zones across the service territory are delineated using a Voronoi polygon approach, based on the locations of NOAA weather sensors. Finally, data-driven models for outage fragility and restoration time are developed for each weather zone. These models enable the quantification and visualization of resilience metrics under varying intensities of extreme weather events. The proposed method is demonstrated using real-world data from a US distribution utility, located in Indianapolis, focused on wind- and precipitation-related events. The dataset spans two decades and includes over 160,000 outage records.
AI Key Findings
Get AI-generated insights about this paper's methodology, results, significance, and more — seven facets brought into focus.
Discussion 0