Publication
Metrics
AI Quick Summary
A data-driven model simulates a 2014 solar flare, reconciling some observed spectral discrepancies, and finds that increasing electron density in the upper chromosphere can reproduce single-peaked MgII line profiles.
Paper Preview
Abstract
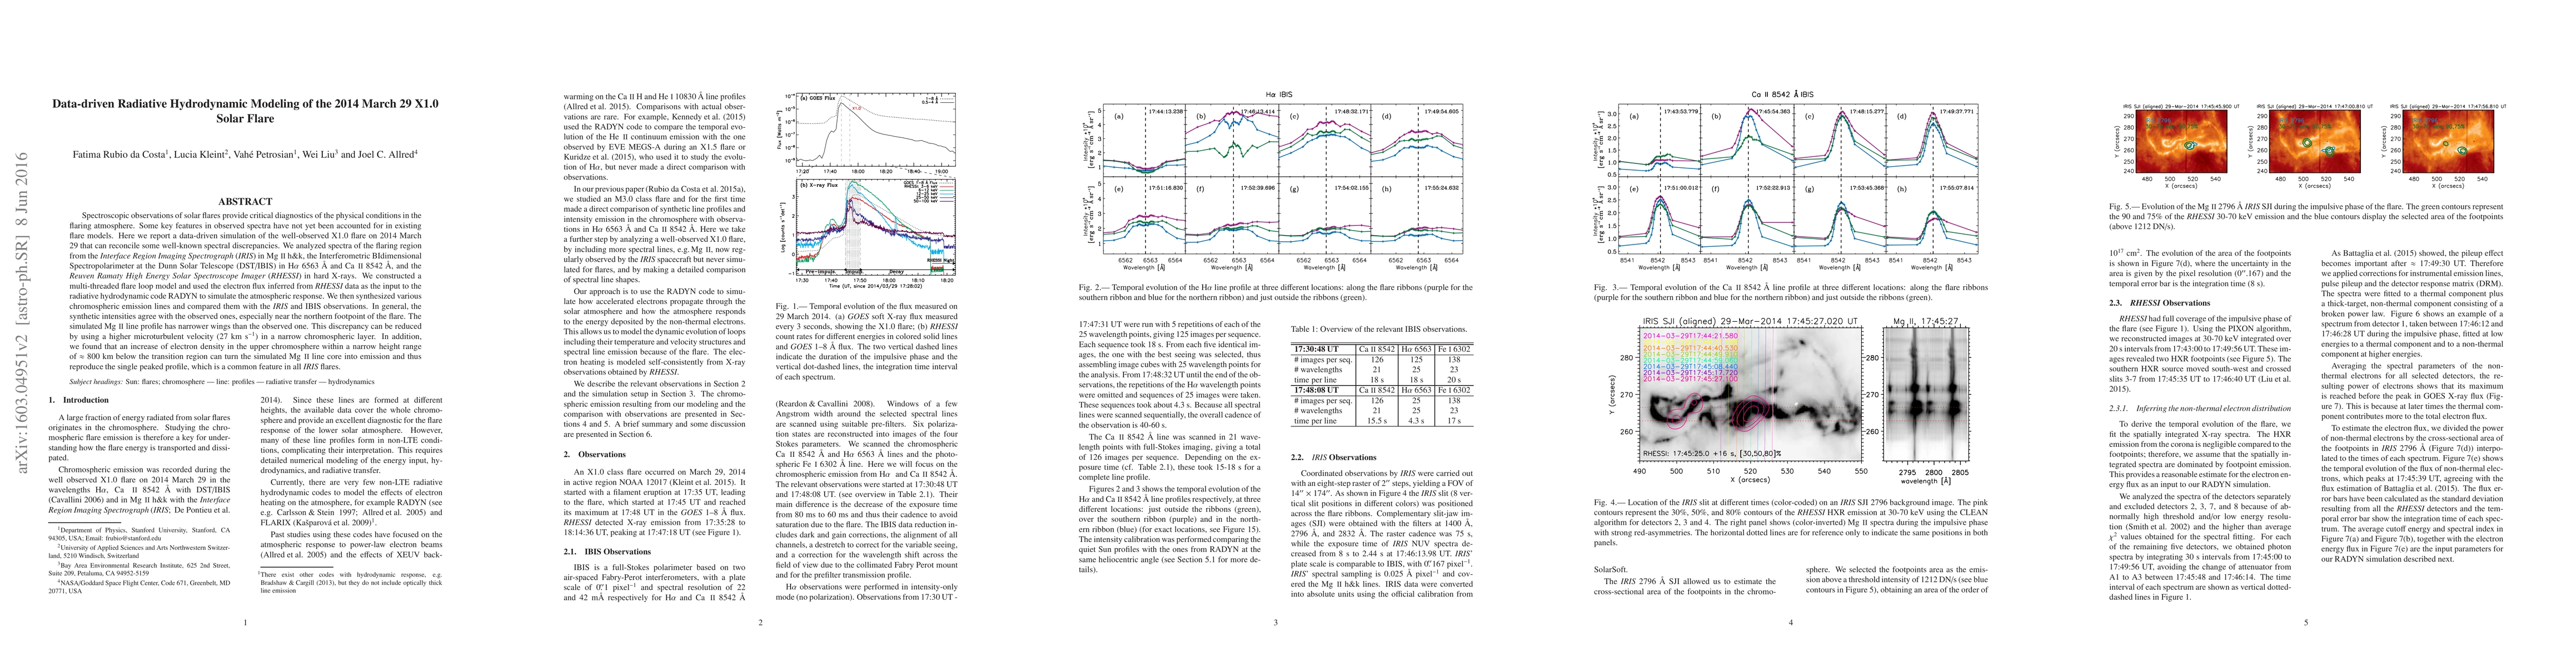
Spectroscopic observations of solar flares provide critical diagnostics of the physical conditions in the flaring atmosphere. Some key features in observed spectra have not yet been accounted for in existing flare models. Here we report a data-driven simulation of the well-observed X1.0 flare on 2014 March 29 that can reconcile some well-known spectral discrepancies. We analyzed spectra of the flaring region from the Interface Region Imaging Spectrograph (IRIS) in MgII h&k, the Interferometric BIdimensional Spectropolarimeter at the Dunn Solar Telescope (DST/IBIS) in H$\alpha$ 6563 \AA\ and CaII 8542 \AA, and the Reuven Ramaty High Energy Solar Spectroscope Imager (RHESSI) in hard X-rays. We constructed a multi-threaded flare loop model and used the electron flux inferred from RHESSI data as the input to the radiative hydrodynamic code RADYN to simulate the atmospheric response. We then synthesized various chromospheric emission lines and compared them with the IRIS and IBIS observations. In general, the synthetic intensities agree with the observed ones, especially near the northern footpoint of the flare. The simulated MgII line profile has narrower wings than the observed one. This discrepancy can be reduced by using a higher microturbulent velocity (27 km/s) in a narrow chromospheric layer. In addition, we found that an increase of electron density in the upper chromosphere within a narrow height range of $\approx$800 km below the transition region can turn the simulated MgII line core into emission and thus reproduce the single peaked profile, which is a common feature in all IRIS flares.
AI Key Findings
Get AI-generated insights about this paper's methodology, results, significance, and more — seven facets brought into focus.
Impact
Paper Details
PDF Preview
Key Terms
Citation Network
Current paper (gray), citations (green), references (blue)
Display is limited for performance on very large graphs.
Discussion 0