This paper introduces a novel data-driven space-filling curve method for 2D and 3D visualization that better preserves spatial features by calculating a Hamiltonian path. The method supports multiscale data and is effective for various visualization tasks, as demonstrated by comparisons with existing techniques.
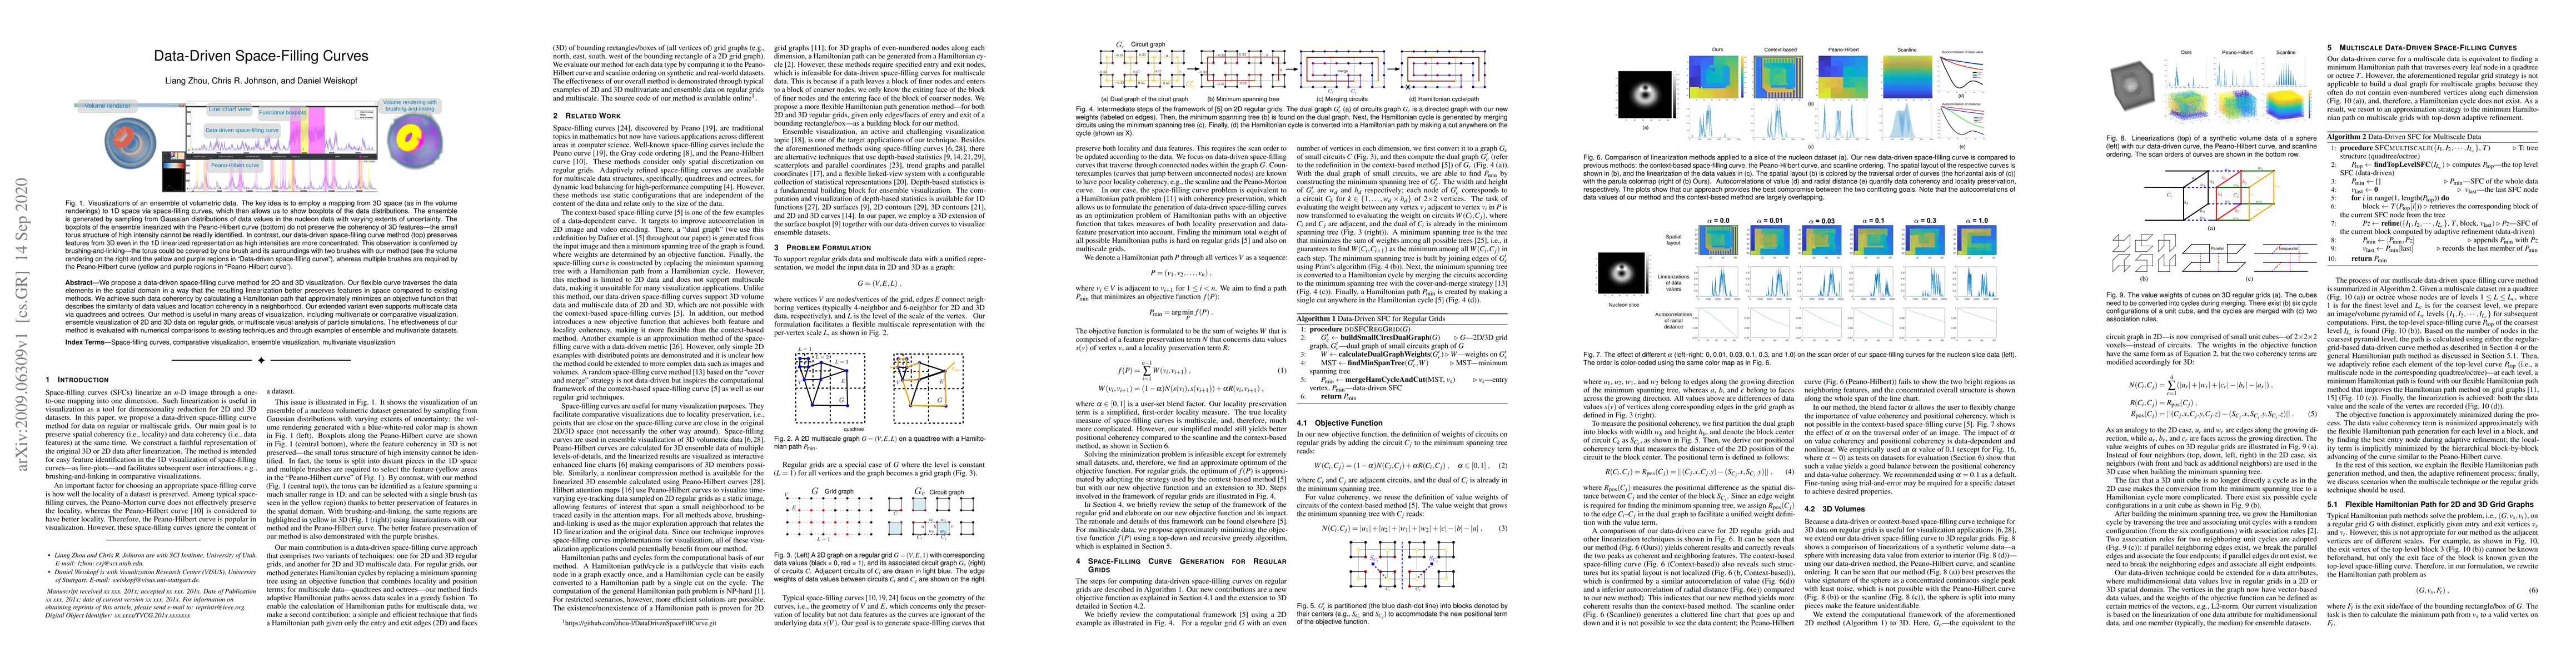
We propose a data-driven space-filling curve method for 2D and 3D visualization. Our flexible curve traverses the data elements in the spatial domain in a way that the resulting linearization better preserves features in space compared to existing methods. We achieve such data coherency by calculating a Hamiltonian path that approximately minimizes an objective function that describes the similarity of data values and location coherency in a neighborhood. Our extended variant even supports multiscale data via quadtrees and octrees. Our method is useful in many areas of visualization, including multivariate or comparative visualization, ensemble visualization of 2D and 3D data on regular grids, or multiscale visual analysis of particle simulations. The effectiveness of our method is evaluated with numerical comparisons to existing techniques and through examples of ensemble and multivariate datasets.
This graph shows how this paper is connected to other research. The current paper is shown in dark gray, papers that cite it are in green, and papers it references are in blue. You can:
• Hover over any node to see the paper title
• Click a node to view that paper's details
• Drag nodes to rearrange the graph
• Use the zoom controls (bottom right) to zoom in/out
Title | Authors | Year | Actions |
---|---|---|---|
BMTree: Designing, Learning, and Updating Piecewise Space-Filling Curves for Multi-Dimensional Data Indexing
|
Jiangneng Li, Yuang Liu, Zheng Wang, Gao Cong, Cheng Long, W. Aref, Han Mao Kiah, Bin Cui
|
2025
|
View Paper |
Using space-filling curves and fractals to reveal spatial and temporal patterns in neuroimaging data
|
J. Grela, Zbigniew Drogosz, Jakub Janarek, Jeremi K. Ochab, Ignacio Cifre, Ewa Gudowska-Nowak, Maciej A Nowak, Pawel Oswiecimka, Dante R. Chialvo
|
2025
|
View Paper |
A Visual Methodology to Assess Spatial Graph Vertex Ordering Algorithms
|
Karelia Salinas, Victor Barella, Thales Vieira, L. G. Nonato
|
2024
|
View Paper |
Interactive Visual Analysis of Spatial Sensitivities
|
Marina Evers, Simon Leistikow, Hennes Rave, Lars Linsen
|
2024
|
View Paper |
A Survey of Designs for Combined 2D+3D Visual Representations
|
Jia-Shun Hong, R. Hnatyshyn, Ebrar A. D. Santos, Ross Maciejewski, Tobias Isenberg
|
2024
|
View Paper |
Fractal Dimension (Df) of Ismail’s Fourth Entropy (HIV⁽q,a1, a2,..,ak⁾) with Fractal Applications to Algorithms, Haptics, and Transportation
|
Ismail A. Mageed
|
2023
|
View Paper |
Fractal Dimension(Df) Theory of Ismail’s Second Entropy(Hq I) with Potential Fractal Applications to ChatGPT, Distributed Ledger Technologies(DLTs) and Image Processing(IP)
|
Ismail A. Mageed
|
2023
|
View Paper |
Efficient Deep Space Filling Curve
|
Wanli Chen, Xufeng Yao, Xinyun Zhang, Bei Yu
|
2023
|
View Paper |
Adaptive Sampling of 3D Spatial Correlations for Focus+Context Visualization
|
Christoph Neuhauser, Josef Stumpfegger, Rüdiger Westermann
|
2023
|
View Paper |
Visual Analsyis of Large Multi-Field AMR Data on GPUs Using Interactive Volume Lines
|
Stefan Zellmann, S. Demirci, U. Güdükbay
|
2023
|
View Paper |
Towards Designing and Learning Piecewise Space-Filling Curves
|
Jiangneng Li, Zheng Wang, Gao Cong, Cheng Long, Han Mao Kiah, Bin Cui
|
2023
|
View Paper |
Temporal Merge Tree Maps: A Topology-Based Static Visualization for Temporal Scalar Data
|
Wiebke Köpp, T. Weinkauf
|
2022
|
View Paper |
Hagrid: using Hilbert and Gosper curves to gridify scatterplots
|
René Cutura, C. Morariu, Zhanglin Cheng, Yunhai Wang, D. Weiskopf, M. Sedlmair
|
2022
|
View Paper |
Neural Space-filling Curves
|
Hanyu Wang, Kamal Gupta, Larry S. Davis, Abhinav Shrivastava
|
2022
|
View Paper |
A Review of Three-Dimensional Medical Image Visualization
|
Liang Zhou, Mengjie Fan, Charles D. Hansen, Chris R. Johnson, D. Weiskopf
|
2022
|
View Paper |
Uncertainty Visualization: Concepts, Methods, and Applications in Biological Data Visualization
|
D. Weiskopf
|
2022
|
View Paper |
Visual Analysis of Spatio‐temporal Phenomena with 1D Projections
|
Max Franke, H. Martin, Steffen Koch, K. Kurzhals
|
2021
|
View Paper |
Analogous to Evolutionary Algorithm: Designing a Unified Sequence Model
|
Jiangning Zhang, Chao Xu, Jian Li, Wenzhou Chen, Yabiao Wang, Ying Tai, Shuo Chen, Chengjie Wang, Feiyue Huang, Yong Liu
|
2021
|
View Paper |
Stable Visual Summaries for Trajectory Collections
|
J. Wulms, J. Buchmüller, Wouter Meulemans, Kevin Verbeek, B. Speckmann
|
2019
|
View Paper |
Data-Driven Computation of Probabilistic Marching Cubes for Efficient Visualization of Level-Set Uncertainty
|
Tushar M. Athawale, Zhe Wang, Chris R. Johnson, D. Pugmire
|
2024
|
View Paper |
A Pipeline for Tailored Sampling for Progressive Visual Analytics
|
Marius Hogräfer, Jakob Burkhardt, Hans-Jörg Schulz
|
2022
|
View Paper |
Immersive Exploration of Brain Simulation Data
|
Jacob Møller Kjeldsen, Juan Manuel Rodriguez
|
View Paper |
Abhinav Shrivastava, Hanyu Wang, Kamal Gupta, Larry Davis
Published: 2022-08-02
David Walker, Anthony Skjellum
Published: 2023-07-18
Han-Bom Moon, Alana Campbell, Flora Dedvukaj, Donald McCormick III, Joshua Morales
Published: 2023-10-17
Comments (0)