Researchers propose a new way to visualize data hunches, allowing experts to externalize their implicit knowledge about datasets, facilitating collaboration and learning from others.
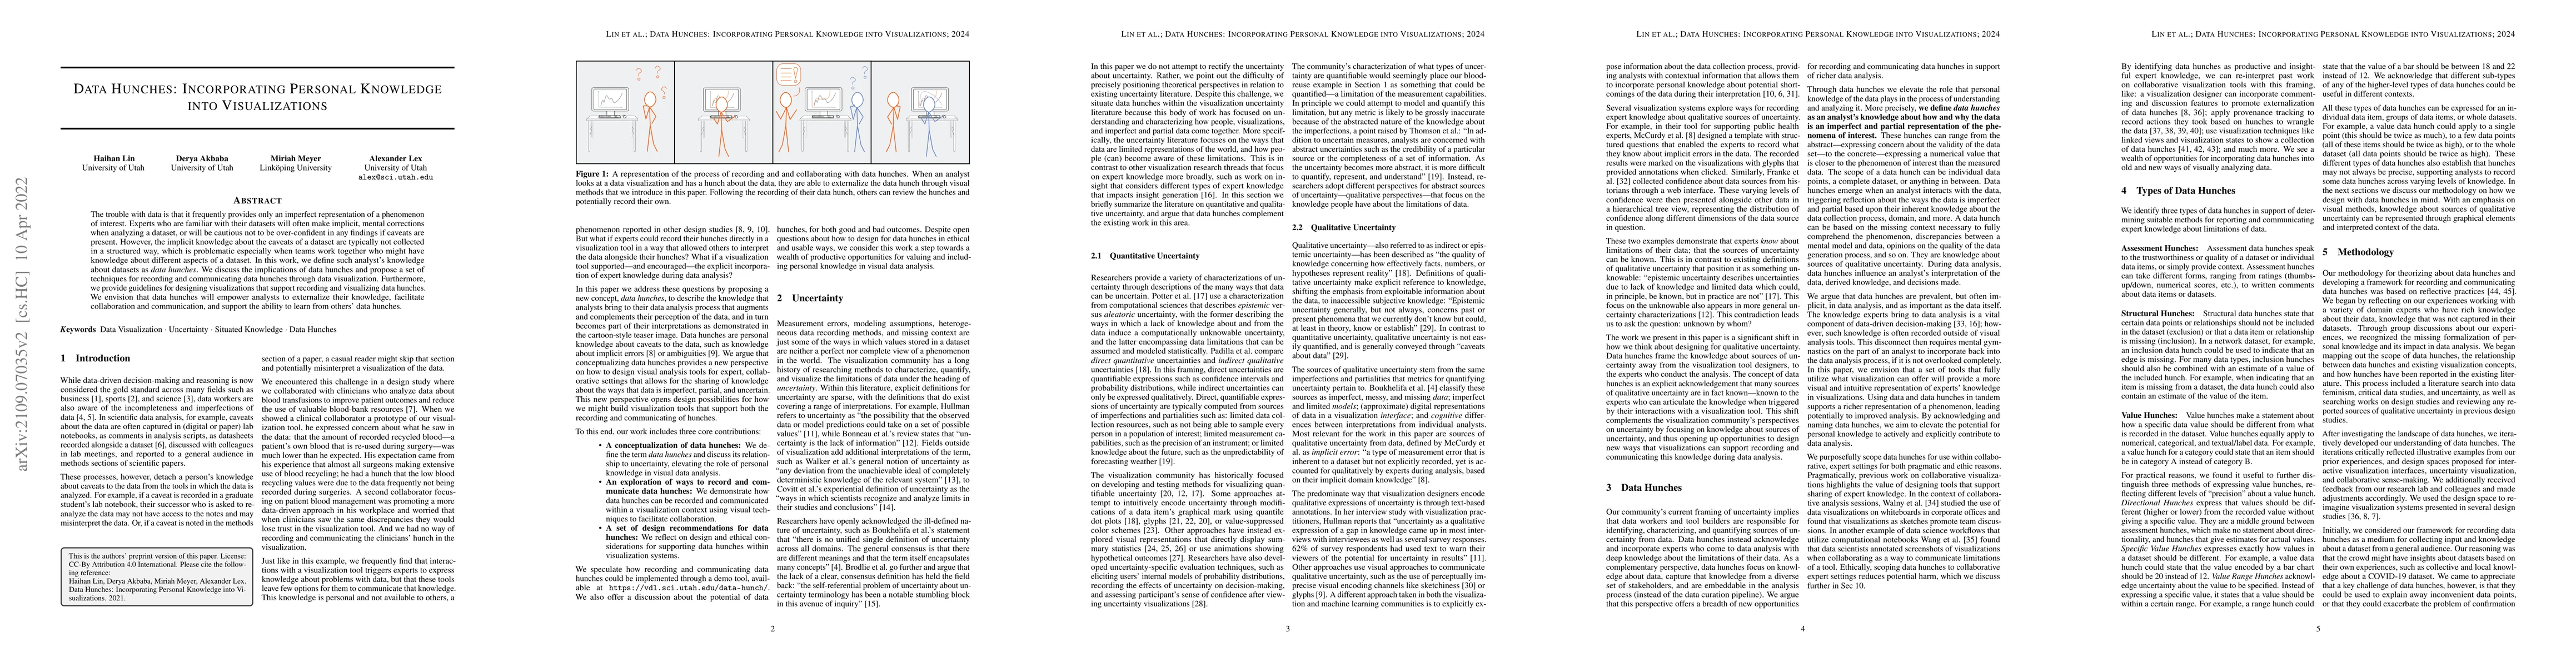
The trouble with data is that it frequently provides only an imperfect representation of a phenomenon of interest. Experts who are familiar with their datasets will often make implicit, mental corrections when analyzing a dataset, or will be cautious not to be over-confident in any findings if caveats are present. However, the implicit knowledge about the caveats of a dataset are typically not collected in a structured way, which is problematic especially when teams work together who might have knowledge about different aspects of a dataset. In this work, we define such analyst's knowledge about datasets as data hunches. We discuss the implications of data hunches and propose a set of techniques for recording and communicating data hunches through data visualization. Furthermore, we provide guidelines for designing visualizations that support recording and visualizing data hunches. We envision that data hunches will empower analysts to externalize their knowledge, facilitate collaboration and communication, and support the ability to learn from others' data hunches.
Get AI-generated insights about this paper's methodology, results, and significance.
Current paper (gray), citations (green), references (blue)
Jeremy D. Watson
Finale Doshi-Velez, Isaac Lage, Sonali Parbhoo
Title | Authors | Year | Actions |
---|---|---|---|
The Human-Data-Model Interaction Canvas for Visual Analytics
|
Jurgen Bernard
|
2025
|
View Paper |
Data Therapist: Eliciting Domain Knowledge from Subject Matter Experts Using Large Language Models
|
Sungbok Shin, Hyeon Jeon, San Hong, Niklas Elmqvist
|
2025
|
View Paper |
Uncertainty in Science is Malleable. Advocating for User-Agency in Defining Uncertainty in Visualizations: a Case Study in Geology
|
Vanessa Peña-Araya, Consuelo Martínez Fontaine, Xiang Wei, Guillaume Delpech, A. Bezerianos
|
2025
|
View Paper |
Intra, Extra, Read all about it! How Readers Interpret Visualizations with Intra- and Extratextual Information
|
Alyxander Burns, Claudia Gonzalez-Vazquez
|
2025
|
View Paper |
Trustworthy by Design: The Viewer's Perspective on Trust in Data Visualization
|
O. McKinley, Saugat Pandey, Alvitta Ottley
|
2025
|
View Paper |
Plume: Scaffolding Text Composition in Dashboards
|
Maxim Lisnic, V. Setlur, N. Sultanum
|
2025
|
View Paper |
Visualising Lived Experience: Learning from a Master Narrative Framing
|
Mai Elshehaly, Mirela Reljan-Delany, J. Dykes, A. Slingsby, J. Wood, Sam Spiegel
|
2024
|
View Paper |
“Working it Out”: Exploring How Digital Technologies Could Support Healthy Ageing at Work
|
Kiersten Hay, Larissa Pschetz, Billy Dixon, Belinda Steffan, Jakov Jandrić, Thanasis Tsanas, Kate Sang, Wendy Loretto
|
2024
|
View Paper |
A Survey on Annotations in Information Visualization: Empirical Insights, Applications, and Challenges
|
Md Dilshadur Rahman, Bhavana Doppalapudi, Ghulam Jilani Quadri, Paul Rosen
|
2024
|
View Paper |
DataGarden: Formalizing Personal Sketches into Structured Visualization Templates
|
A. Offenwanger, Theophanis Tsandilas, Fanny Chevalier
|
2024
|
View Paper |
Entanglements for Visualization: Changing Research Outcomes through Feminist Theory
|
Derya Akbaba, Lauren Klein, Miriah Meyer
|
2024
|
View Paper |
Exploring annotation taxonomy in grouped bar charts: A qualitative classroom study
|
Md Dilshadur Rahman, Ghulam Jilani Quadri, D. Szafir, Paul Rosen
|
2024
|
View Paper |
From Data Dump to Digestible Chunks: Automated Segmentation and Summarization of Provenance Logs for Communication
|
Jeremy E. Block, Donald R. Honeycutt, Brett Benda, Benjamin Rheault, Eric D. Ragan
|
2024
|
View Paper |
Our Stories, Our Data: Co-designing Visualizations with People with Intellectual and Developmental Disabilities
|
Keke Wu, Ghulam Jilani Quadri, Arran Zeyu Wang, David Kwame Osei-Tutu, Emma Petersen, Varsha Koushik, D. Szafir
|
2024
|
View Paper |
Enhancing User Perception of Reliability in Computer Vision: Uncertainty Visualization for Probability Distributions
|
Xinyue Wang, Ruoyu Hu, Chengqi Xue
|
2024
|
View Paper |
Discursive Patinas: Anchoring Discussions in Data Visualizations
|
Tobias Kauer, Derya Akbaba, M. Dörk, Benjamin Bach
|
2024
|
View Paper |
"Yeah, this graph doesn't show that": Analysis of Online Engagement with Misleading Data Visualizations
|
Maxim Lisnic, Alexander Lex, Marina Kogan
|
2024
|
View Paper |
Watching the Election Sausage Get Made: How Data Journalists Visualize the Vote Counting Process in U.S. Elections
|
Mandi Cai, Matthew Kay
|
2024
|
View Paper |
Input Visualization: Collecting and Modifying Data with Visual Representations
|
Nathalie Bressa, Jordan Louis, Wesley Willett, Samuel Huron
|
2024
|
View Paper |
Towards Understanding the Authoring Strategy and Effectiveness of Visualization Sketches
|
Ruike Jiang, Yiheng Liang, Hanning Shao, Le Liu, Xiaoru Yuan
|
2024
|
View Paper |
What We Augment When We Augment Visualizations: A Design Elicitation Study of How We Visually Express Data Relationships
|
G. Guo, J. Stasko, A. Endert
|
2024
|
View Paper |
Metaphors and `Tacit' Data: the Role of Metaphors in Data and Physical Data Representations
|
Rosa van Koningsbruggen, Luke Haliburton, Beat Rossmy, Ceenu George, Eva Hornecker, Bart Hengeveld
|
2024
|
View Paper |
TimeSplines: Sketch-Based Authoring of Flexible and Idiosyncratic Timelines
|
A. Offenwanger, M. Brehmer, Fanny Chevalier, Theophanis Tsandilas
|
2023
|
View Paper |
Transitioning to a Commercial Dashboarding System: Socio-Technical Observations and Opportunities
|
C. Walchshofer, Vaishali Dhanoa, Marc Streit, Miriah Meyer
|
2023
|
View Paper |
Designing for Ambiguity in Visual Analytics: Lessons from Risk Assessment and Prediction
|
Stanislaw Nowak, L. Bartram
|
2023
|
View Paper |
Heuristics for Supporting Cooperative Dashboard Design
|
V. Setlur, M. Correll, Arvind Satyanarayan, Melanie Tory
|
2023
|
View Paper |
From Information to Choice: A Critical Inquiry Into Visualization Tools for Decision Making
|
E. Oral, Ria Chawla, Michel Wijkstra, Narges Mahyar, Evanthia Dimara
|
2023
|
View Paper |
A Qualitative Analysis of Common Practices in Annotations: A Taxonomy and Design Space
|
Md Dilshadur Rahman, Ghulam Jilani Quadri, Bhavana Doppalapudi, D. Szafir, Paul Rosen
|
2023
|
View Paper |
Misleading Beyond Visual Tricks: How People Actually Lie with Charts
|
Maxim Lisnic, Cole Polychronis, A. Lex, M. Kogan
|
2023
|
View Paper |
Iceberg Sensemaking: A Process Model for Critical Data Analysis and Visualization
|
C. Berret, T. Munzner
|
2022
|
View Paper |
H ERE ’ S WHAT YOU NEED TO KNOW ABOUT MY DATA : E XPLORING E XPERT K NOWLEDGE ’ S R OLE IN D ATA A NALYSIS
|
Haihan Lin, Maxim Lisnic, Derya Akbaba, Miriah D. Meyer, Alexander Lex
|
2023
|
View Paper |
I'm Not Sure: Designing for Ambiguity in Visual Analytics
|
Stanislaw Nowak, L. Bartram
|
2022
|
View Paper |
Visualization Challenges of Variant Interpretation in Multiscale NGS Data
|
E. Ståhlbom, J. Molin, C. Lundström, A. Ynnerman
|
2022
|
View Paper |
DataGarden: Formalizing Personal Sketches into Structured Visualization Templates
|
View Paper | ||
DataGarden: Formalizing Personal Sketches into Structured Visualization Templates
|
View Paper |
Comments (0)