A study of 42 rural Pennsylvania residents found that attitudes towards data visualization are shaped by factors like education, politics, and personal experience. The research highlights the need for more inclusive design guidelines to better serve diverse populations.
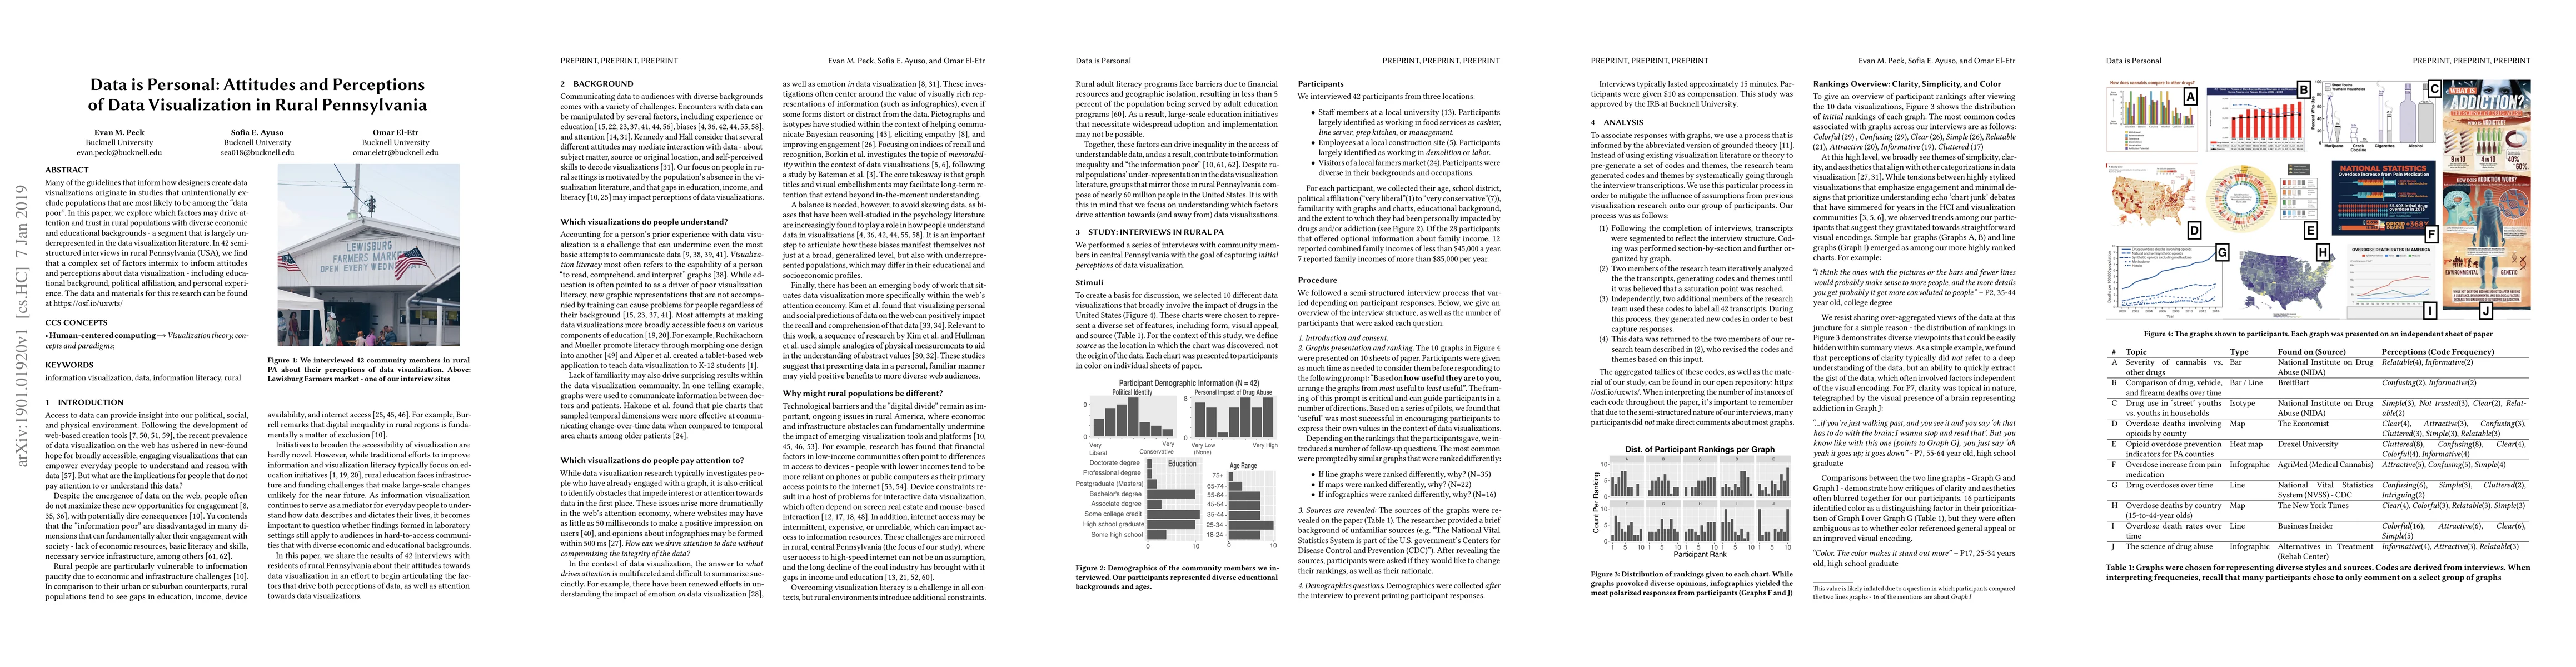
Many of the guidelines that inform how designers create data visualizations originate in studies that unintentionally exclude populations that are most likely to be among the 'data poor'. In this paper, we explore which factors may drive attention and trust in rural populations with diverse economic and educational backgrounds - a segment that is largely underrepresented in the data visualization literature. In 42 semi-structured interviews in rural Pennsylvania (USA), we find that a complex set of factors intermix to inform attitudes and perceptions about data visualization - including educational background, political affiliation, and personal experience. The data and materials for this research can be found at https://osf.io/uxwts/
Get AI-generated insights about this paper's methodology, results, and significance.
Current paper (gray), citations (green), references (blue)
Title | Authors | Year | Actions |
---|---|---|---|
SurpriseExplora: Tuning and Contextualizing Model‐derived Maps with Interactive Visualizations
|
A. Ndlovu, H. Shrestha, E. Peck, L. Harrison
|
2025
|
View Paper |
Chart-to-Experience: Benchmarking Multimodal LLMs for Predicting Experiential Impact of Charts
|
Seon Gyeom Kim, Jae Young Choi, Ryan Rossi, Eunyee Koh, Tak Yeon Lee
|
2025
|
View Paper |
Modeling and Measuring the Chart Communication Recall Process
|
A. Arunkumar, L. Padilla, C. Bryan
|
2025
|
View Paper |
Double Tap for This Post: Understanding the Communication of Data Visualization on Social Media
|
Yang Shi, Yechun Peng, Jieying Ding, Xingyu Lan, Nan Cao
|
2025
|
View Paper |
Data Bias Recognition in Museum Settings: Framework Development and Contributing Factors
|
Stella Quinto Lima, Gabriela Buraglia, Wong Kam-Kwai, Jessica Roberts
|
2025
|
View Paper |
The Interaction Geography Slicer: Designing Exploratory Spatial Data Visualization Tools for Teachers' Reflective Practice
|
Ben Rydal Shapiro, Elizabeth C Metts, Edwin Zhao
|
2025
|
View Paper |
Intra, Extra, Read all about it! How Readers Interpret Visualizations with Intra- and Extratextual Information
|
Alyxander Burns, Claudia Gonzalez-Vazquez
|
2025
|
View Paper |
Do You"Trust"This Visualization? An Inventory to Measure Trust in Visualizations
|
Huichen Will Wang, Kylie Lin, Andrew Cohen, Ryan Kennedy, Zach Zwald, Carolina Nobre, Cindy Xiong Bearfield
|
2025
|
View Paper |
Trustworthy by Design: The Viewer's Perspective on Trust in Data Visualization
|
O. McKinley, Saugat Pandey, Alvitta Ottley
|
2025
|
View Paper |
Towards Collective Storytelling: Investigating Audience Annotations in Data Visualizations
|
Tobias Kauer, M. Dörk, Benjamin Bach
|
2025
|
View Paper |
Narrative visualizations: Depicting accumulating risks and increasing trust in data
|
M. Fansher, Logan Walls, Chenxu Hao, Hari Subramonyam, Aysecan Boduroglu, Priti Shah, Jessica K Witt
|
2025
|
View Paper |
The Social Construction of Visualizations: Practitioner Challenges and Experiences of Visualizing Race and Gender
|
Priya Dhawka, Sayamindu Dasgupta
|
2025
|
View Paper |
Commemoration and Context: The Death Counter Graphics of COVID-19
|
Daniel Liddle
|
2024
|
View Paper |
Misleading Whom? Assumptions about Map Users and Engagement Contexts in COVID-19 Map Misleadingness Claims
|
Johanna Meyer, D. Stanton Fraser, Julie Barnett
|
2024
|
View Paper |
Testing the Test: Observations When Assessing Visualization Literacy of Domain Experts
|
Seyda Öney, Moataz Abdelaal, K. Kurzhals, Paul Betz, Cordula Kropp, D. Weiskopf
|
2024
|
View Paper |
What University Students Learn In Visualization Classes
|
Maryam Hedayati, Matthew Kay
|
2024
|
View Paper |
Entanglements for Visualization: Changing Research Outcomes through Feminist Theory
|
Derya Akbaba, Lauren Klein, Miriah Meyer
|
2024
|
View Paper |
Reimagining Data Visualization to Address Sustainability Goals
|
Narges Mahyar
|
2024
|
View Paper |
Causal Priors and Their Influence on Judgements of Causality in Visualized Data
|
Arran Zeyu Wang, D. Borland, Tabitha C. Peck, Wenyuan Wang, David Gotz
|
2024
|
View Paper |
Our Stories, Our Data: Co-designing Visualizations with People with Intellectual and Developmental Disabilities
|
Keke Wu, Ghulam Jilani Quadri, Arran Zeyu Wang, David Kwame Osei-Tutu, Emma Petersen, Varsha Koushik, D. Szafir
|
2024
|
View Paper |
Discursive Patinas: Anchoring Discussions in Data Visualizations
|
Tobias Kauer, Derya Akbaba, M. Dörk, Benjamin Bach
|
2024
|
View Paper |
“I Came Across a Junk”: Understanding Design Flaws of Data Visualization from the Public's Perspective
|
Xingyu Lan, Yu Liu
|
2024
|
View Paper |
Visualisations with semantic icons: Assessing engagement with distracting elements
|
Muna Alebri, Enrico Costanza, Georgia Panagiotidou, Duncan P. Brumby, Fatima Althani, Riccardo Bovo
|
2024
|
View Paper |
Enhancing Data Literacy On-demand: LLMs as Guides for Novices in Chart Interpretation.
|
Kiroong Choe, Chaerin Lee, S. Lee, Jiwon Song, Aeri Cho, Nam Wook Kim, Jinwook Seo
|
2024
|
View Paper |
PhDs—Portugal has Doctors: A Visualization of Academia Achievements in Portugal From 1970 to 2022
|
Pedro Silva, Pedro Martins, Penousal Machado
|
2024
|
View Paper |
"Yeah, this graph doesn't show that": Analysis of Online Engagement with Misleading Data Visualizations
|
Maxim Lisnic, Alexander Lex, Marina Kogan
|
2024
|
View Paper |
Toward a More Comprehensive Understanding of Visualization Literacy
|
Lily W. Ge, Maryam Hedayati, Yuanling Cui, Yiren Ding, Karen Bonilla, Alark Joshi, Alvitta Ottley, B. Bach, Bum Chul Kwon, David N. Rapp, E. Peck, Lace M. Padilla, Michael Correll, M. Borkin, L. Harrison, Matthew Kay
|
2024
|
View Paper |
DataDive: Supporting Readers' Contextualization of Statistical Statements with Data Exploration
|
Hyunwoo Kim, Khanh-Duy Le, Gionnieve Lim, Dae Hyun Kim, Yoo Jin Hong, Juho Kim
|
2024
|
View Paper |
NOVA: A visual interface for assessing polarizing media coverage
|
Keshav Dasu, Sam Yu-Te Lee, Ying-Cheng Chen, Kwan-Liu Ma
|
2024
|
View Paper |
Exploring patient perspectives on EQ-5D-5L data visualization within an individualized decision aid for total knee arthroplasty (TKA) in Alberta, Canada
|
Jeffrey A. Johnson, A. Itiola, Shakib Rahman, Christopher Smith, A. Soprovich, Lisa A. Wozniak, Deborah A. Marshall
|
2024
|
View Paper |
Designing Survey-Based Mobile Interfaces for Rural Patients With Cancer Using Apple’s ResearchKit and CareKit: Usability Study
|
Alyssa Donawa, Christian D. Powell, Rong Wang, Ming-Yuan Chih, Reema Patel, Ralph Zinner, Eliah S Aronoff-Spencer, C. Baker
|
2024
|
View Paper |
Do You See What I See? A Qualitative Study Eliciting High-Level Visualization Comprehension
|
Ghulam Jilani Quadri, Arran Zeyu Wang, Zhehao Wang, Jennifer Adorno, Paul Rosen, D. Szafir
|
2024
|
View Paper |
Situating Datasets: Making Public Eviction Data Actionable for Housing Justice
|
Anh-Ton Tran, Grace Guo, Jordan Taylor, Katsuki Chan, Elora Raymond, Carl Disalvo
|
2024
|
View Paper |
Trust in maps: what we know and what we need to know
|
Timothy J. Prestby
|
2023
|
View Paper |
Multiple-Stakeholder Perspectives on Accessibility Data and the Use of Socio-Technical Tools to Improve Sidewalk Accessibility
|
D. Labbé, Yochai Eisenberg, Devon Snyder, Judy L. Shanley, Joy M. Hammel, Jon E. Froehlich
|
2023
|
View Paper |
From Shock to Shift: Data Visualization for Constructive Climate Journalism
|
F. Morini, Anna Eschenbacher, Johanna Hartmann, M. Dörk
|
2023
|
View Paper |
Embellishments Revisited: Perceptions of Embellished Visualisations Through the Viewer's Lens
|
Muna Alebri, Enrico Costanza, Georgia Panagiotidou, Duncan P. Brumby
|
2023
|
View Paper |
Enthusiastic and Grounded, Avoidant and Cautious: Understanding Public Receptivity to Data and Visualizations
|
H. He, Jagoda Walny, Sonja Thoma, Sheelagh Carpendale, Wesley Willett
|
2023
|
View Paper |
The Gulf of Interpretation: From Chart to Message and Back Again
|
Christian Knoll, T. Möller, Kathleen Gregory, Laura Koesten
|
2023
|
View Paper |
Beyond English: Centering Multilingualism in Data Visualization
|
Noëlle Rakotondravony, Priya Dhawka, Melanie Bancilhon
|
2023
|
View Paper |
Design of tailored asthma control status infographics
|
Adriana Arcia, Nicole Spiegel-Gotsch, Maureen George
|
2023
|
View Paper |
Eleven Years of Gender Data Visualization: A Step Towards More Inclusive Gender Representation
|
Florent Cabric, M. Bjarnadóttir, Meng-Ying Ling, Guðbjörg Linda Rafnsdóttir, Petra Isenberg
|
2023
|
View Paper |
My Model is Unfair, Do People Even Care? Visual Design Affects Trust and Perceived Bias in Machine Learning
|
Aimen Gaba, Zhanna Kaufman, Jason Chueng, Marie Shvakel, Kyle Wm. Hall, Yuriy Brun, Cindy Xiong Bearfield
|
2023
|
View Paper |
Image or Information? Examining the Nature and Impact of Visualization Perceptual Classification
|
Anjana Arunkumar, Lace M. K. Padilla, Gi-Yeul Bae, Chris Bryan
|
2023
|
View Paper |
Chatting About Data - Interacting with Voice Interfaces to Engage with Election Panel Data
|
Bernhard Jordan, Laura Koesten, T. Möller
|
2023
|
View Paper |
“Customization is Key”: Reconfigurable Textual Tokens for Accessible Data Visualizations
|
Shuli Jones, Isabella Pedraza Pineros, Daniel Hajas, Jonathan Zong, Arvind Satyanarayan
|
2023
|
View Paper |
UbiSecE: UbiLab’s Secure Cloud Environment for Public Health Research in Microsoft Azure
|
Pedro Miranda, Jasleen Kaur, P. Morita
|
2023
|
View Paper |
More Than Data Stories: Broadening the Role of Visualization in Contemporary Journalism
|
Yu Fu, J. Stasko
|
2023
|
View Paper |
Understanding and Measuring the Effects of Graphical Dimensions on Viewers' Perceived Chart Credibility
|
Hayeong Song, J. Stasko
|
2023
|
View Paper |
Are interactive and tailored data visualizations effective in promoting flu vaccination among the elderly? Evidence from a randomized experiment
|
Lynne M. Cotter, Sijia Yang
|
2023
|
View Paper |
Who Do We Mean When We Talk About Visualization Novices?
|
Alyxander Burns, C. Lee, Ria Chawla, Evan M. Peck, Narges Mahyar
|
2023
|
View Paper |
Misleading Beyond Visual Tricks: How People Actually Lie with Charts
|
Maxim Lisnic, Cole Polychronis, A. Lex, M. Kogan
|
2023
|
View Paper |
Troubling Collaboration: Matters of Care for Visualization Design Study
|
Derya Akbaba, Devin Lange, M. Correll, A. Lex, Miriah D. Meyer
|
2023
|
View Paper |
We are the Data: Challenges and Opportunities for Creating Demographically Diverse Anthropographics
|
Priya Dhawka, H. He, Wesley Willett
|
2023
|
View Paper |
Communicating Consequences: Visual Narratives, Abstraction, and Polysemy in Rural Bangladesh
|
S. Sultana, Syed Ishtiaque Ahmed, Jeffrey M. Rzeszotarski
|
2023
|
View Paper |
Visual Task Performance and Spatial Abilities: An Investigation of Artists and Mathematicians
|
Sara Tandon, Alfie Abdul-Rahman, R. Borgo
|
2023
|
View Paper |
Mini‐VLAT: A Short and Effective Measure of Visualization Literacy
|
Saugat Pandey, Alvitta Ottley
|
2023
|
View Paper |
Social studies teachers’ perceptions of the credibility and meaning of data visualisations for teaching
|
J. Myers
|
2023
|
View Paper |
Transparent Dashboards: Open data practices for promoting competition-as-motivation in business dashboards
|
Triana R. Hadiprawoto, Arran L. Ridley
|
2023
|
View Paper |
Evaluating narrative visualization: a survey of practitioners
|
Nina Errey, Jie Liang, T. Leong, Didar Zowghi
|
2023
|
View Paper |
User Perceptions of Actionability in Data Dashboards
|
M. Sorapure
|
2023
|
View Paper |
On the Impact of Explanations on Understanding of Algorithmic Decision-Making
|
Timothée Schmude, Laura Koesten, T. Möller, Sebastian Tschiatschek
|
2023
|
View Paper |
From Invisible to Visible: Impacts of Metadata in Communicative Data Visualization
|
Alyxander Burns, C. Lee, Thai On, Cindy Xiong, Evan M. Peck, Narges Mahyar
|
2022
|
View Paper |
“Being Simple on Complex Issues” – Accounts on Visual Data Communication About Climate Change
|
Regina Schuster, Kathleen Gregory, T. Möller, Laura Koesten
|
2022
|
View Paper |
Expert Goggles: Detecting and Annotating Visualizations using a Machine Learning Classifier
|
S. Macneil, Parth Patel, Benjamin E. Smolin
|
2022
|
View Paper |
Representing Marginalized Populations: Challenges in Anthropographics
|
Priya Dhawka, H. He, Wesley Willett
|
2022
|
View Paper |
Let's Get Personal: Exploring the Design of Personalized Visualizations
|
Beleicia B. Bullock, Shunan Guo, E. Koh, R. Rossi, F. Du, J. Hoffswell
|
2022
|
View Paper |
Breaking the Fourth Wall of Data Stories through Interaction
|
Yang Shi, Tian Gao, Xiaohan Jiao, Nan Cao
|
2022
|
View Paper |
Bias-Aware Design for Informed Decisions: Raising Awareness of Self-Selection Bias in User Ratings and Reviews
|
Qian Zhu, Leo Yu-Ho Lo, Meng Xia, Zixin Chen, Xiaojuan Ma
|
2022
|
View Paper |
Measuring Effects of Spatial Visualization and Domain on Visualization Task Performance: A Comparative Study
|
Sara Tandon, Alfie Abdul-Rahman, R. Borgo
|
2022
|
View Paper |
Affective Learning Objectives for Communicative Visualizations
|
Elsie Lee-Robbins, Eytan Adar
|
2022
|
View Paper |
A Context-Aware Browser Extension for Just-in-Time Learning of Data Literacy Skills
|
S. Macneil, Joshua Withka, Aaron Wile, Parth Patel, Emily Jao, Margaret Hanley
|
2022
|
View Paper |
? A Cross-Language Study of How People Verbalize Probabilities in Icon Array Visualizations
|
Noëlle Rakotondravony, Yiren Ding, L. Harrison
|
2022
|
View Paper |
Application of Data Visualization Technology Under the Background of Big Data
|
Feng Li, Lingling Wang
|
2022
|
View Paper |
Note: Assessing Cancer Patient Usability of a Mobile Distress Screening App
|
Alyssa Donawa, C. Powell, Rong Wang, Ming-Yuan Chih, E. Spencer, C. Baker
|
2022
|
View Paper |
Opportunities and risks for engaging research participants with self-logged menstrual health data
|
Samantha Robertson, K. Harley, Niloufar Salehi
|
2022
|
View Paper |
Of Course it's Political! A Critical Inquiry into Underemphasized Dimensions in Civic Text Visualization
|
E. Baumer, Mahmood Jasim, Ali Sarvghad, Narges Mahyar
|
2022
|
View Paper |
P-Lite: A study of parallel coordinate plot literacy
|
Elif E. Firat, A. Denisova, Max L. Wilson, R. Laramee
|
2022
|
View Paper |
Developing Self-Advocacy Skills through Machine Learning Education: The Case of Ad Recommendation on Facebook
|
Yim Register, Emma S. Spiro
|
2022
|
View Paper |
Inferential Tasks as an Evaluation Technique for Visualization
|
Ashley Suh, Abigail Mosca, Shannon Robinson, Quinn Pham, Dylan Cashman, Alvitta Ottley, Remco Chang
|
2022
|
View Paper |
Visualizing Urban Accessibility: Investigating Multi-Stakeholder Perspectives through a Map-based Design Probe Study
|
Manaswi Saha, Siddhant Patil, E. Cho, Evie (Yu-Yen) Cheng, Chris Horng, Devanshi, Chauhan, Rachel Kangas, Richard McGovern, Anthony Li, Jeffrey Heer, Jon E. Froehlich, Chris, Horng, Devanshi Chauhan
|
2022
|
View Paper |
Negative Emotions, Positive Outcomes? Exploring the Communication of Negativity in Serious Data Stories
|
Xingyu Lan, Yanqiu Wu, Yang Shi, Qing Chen, Nan Cao
|
2022
|
View Paper |
Juvenile Graphical Perception: A Comparison between Children and Adults
|
Liudas Panavas, Amy E. Worth, Tarik Crnovrsanin, Tejas Sathyamurthi, Sara Cordes, M. Borkin, Cody Dunne
|
2022
|
View Paper |
Annotating Line Charts for Addressing Deception
|
Arlen Fan, Yuxin Ma, M. Mancenido, Ross Maciejewski
|
2022
|
View Paper |
Recommendations for Visualization Recommendations: Exploring Preferences and Priorities in Public Health
|
Calvin Bao, Siyao Li, Sarah Flores, M. Correll, L. Battle
|
2022
|
View Paper |
Visualization as infrastructure: China’s data visualization politics during COVID-19 and their implications for public health emergencies
|
Luming Zhao, Weiming Ye
|
2022
|
View Paper |
Conceptualising fairness: three pillars for medical algorithms and health equity
|
Laura Sikstrom, M. Maslej, Katrina Hui, Zoe Findlay, Daniel Z. Buchman, Sean L. Hill
|
2022
|
View Paper |
Storytelling in data visualization: information bias
|
Jaqueline Vasconcelos Braga, Tiago Barros Pontes e Silva
|
2021
|
View Paper |
Challenges in Everyday Use of Mobile Visualizations
|
Daniel A. Epstein, Tanja Blascheck, Sheelagh Carpendale, Raimund Dachselt, Jo Vermeulen
|
2021
|
View Paper |
Evaluating Mobile Visualizations
|
F. Bentley, E. Choe, Lena Mamykina, J. Stasko, Pourang Irani
|
2021
|
View Paper |
Towards a universal cognitive tool
|
Keke Wu
|
2021
|
View Paper |
Towards a Theory of Bullshit Visualization
|
M. Correll
|
2021
|
View Paper |
Data Hunches: Incorporating Personal Knowledge into Visualizations
|
Haihan Lin, Derya Akbaba, Miriah D. Meyer, A. Lex
|
2021
|
View Paper |
Visualization for Villainy
|
A. Mcnutt, Lilian Huang, Kathryn E. Koenig
|
2021
|
View Paper |
Making the Invisible Visible: Risks and Benefits of Disclosing Metadata in Visualization
|
Alyxander Burns, Thai On, C. Lee, R. Shapiro, Cindy Xiong, Narges Mahyar
|
2021
|
View Paper |
Exploring the Personal Informatics Analysis Gap: “There's a Lot of Bacon”
|
Jimmy Moore, Pascal Goffin, Jason Wiese, Miriah D. Meyer
|
2021
|
View Paper |
Making Sense of Sensemaking: Understanding How K-12 Teachers and Coaches React to Visual Analytics
|
Fabio Campos, June Ahn, Daniela K. Digiacomo, Ha Nguyen, Maria Hays
|
2021
|
View Paper |
Implicit Error, Uncertainty and Confidence in Visualization: An Archaeological Case Study
|
Georgia Panagiotidou, R. Vandam, J. Poblome, A. Moere
|
2021
|
View Paper |
Topography of Violence: Considerations for Ethical and Collaborative Visualization Design
|
F. Ehmel, V. Brüggemann, M. Dörk
|
2021
|
View Paper |
Exploring Approaches to Data Literacy Through a Critical Race Theory Perspective
|
Britney Johnson, B. Shapiro, Betsy Disalvo, Annabel Rothschild, C. Disalvo
|
2021
|
View Paper |
Understanding Narrative Linearity for Telling Expressive Time-Oriented Stories
|
Xingyu Lan, Xinyue Xu, Nan Cao
|
2021
|
View Paper |
Understanding Data Accessibility for People with Intellectual and Developmental Disabilities
|
Keke Wu, Emma Petersen, Tahmina Ahmad, David Burlinson, Shea Tanis, D. Szafir
|
2021
|
View Paper |
Smile or Scowl? Looking at Infographic Design Through the Affective Lens
|
Xingyu Lan, Yang Shi, Yueyao Zhang, Nan Cao
|
2021
|
View Paper |
The Public Life of Data: Investigating Reactions to Visualizations on Reddit
|
Tobias Kauer, Arran L. Ridley, M. Dörk, B. Bach
|
2021
|
View Paper |
The Next Billion Users of Visualization
|
Amit Jena, M. Butler, Tim Dwyer, K. Ellis, U. Engelke, Reuben Kirkham, K. Marriott, Cécile Paris, Venkatesh Rajamanickam, T. Rhyne
|
2021
|
View Paper |
TRANSLATING EVIDENCE INTO POLICY IMPACT: A CALL TO ACTION FOR FORMATIVE POLICY EVALUATION TO PROMOTE EVIDENCE‐BASED DECISIONMAKING
|
E. Martin
|
2021
|
View Paper |
Susceptibility of domain experts to color manipulation indicate a need for design principles in data visualization.
|
M. Christen, P. Brugger, S. Fabrikant
|
2021
|
View Paper |
Beyond Expertise and Roles: A Framework to Characterize the Stakeholders of Interpretable Machine Learning and their Needs
|
Harini Suresh, Steven R. Gomez, K. Nam, Arvind Satyanarayan
|
2021
|
View Paper |
Viral Visualizations: How Coronavirus Skeptics Use Orthodox Data Practices to Promote Unorthodox Science Online
|
Crystal Lee, Tanya Yang, Gabrielle Inchoco, Graham M. Jones, Arvind Satyanarayan
|
2021
|
View Paper |
Vis Ex Machina: An Analysis of Trust in Human versus Algorithmically Generated Visualization Recommendations
|
Rachael Zehrung, A. Singhal, M. Correll, L. Battle
|
2021
|
View Paper |
Seeing in Context
|
S. Sultana, Syed Ishtiaque Ahmed, Jeffrey M. Rzeszotarski
|
2021
|
View Paper |
Umbra: A Visual Analysis Approach for Defense Construction Against Inference Attacks on Sensitive Information
|
Xumeng Wang, Chris Bryan, Yiran Li, Rusheng Pan, Yanling Liu, Wei Chen, K. Ma
|
2020
|
View Paper |
Civic Technologies: Research, Practice and Open Challenges
|
Pablo Aragón, A. Garcia, C. L. Dantec, Claudia Flores-Saviaga, Jorge Saldivar
|
2020
|
View Paper |
Rare, but Valuable: Understanding Data-centered Talk in News Website Comment Sections
|
B. McInnis, Lu Sun, Jungwon Shin, Steven W. Dow
|
2020
|
View Paper |
Data Visualisation Literacy in Higher Education: An Exploratory Study of Understanding of a Learning Dashboard Tool
|
David G. Donohoe, E. Costello
|
2020
|
View Paper |
Showing Data About People: A Design Space of Anthropographics
|
Luiz Morais, Yvonne Jansen, N. Andrade, Pierre Dragicevic
|
2020
|
View Paper |
DebateVis: Visualizing Political Debates for Non-Expert Users
|
Laura South, Michail Schwab, Nick Beauchamp, Lu Wang, John P. Wihbey, M. Borkin
|
2020
|
View Paper |
Mapping the Landscape of COVID-19 Crisis Visualizations
|
Yixuan Zhang, Yifan Sun, Lace M. K. Padilla, Sumit Barua, E. Bertini, A. Parker
|
2020
|
View Paper |
Why Shouldn’t All Charts Be Scatter Plots? Beyond Precision-Driven Visualizations
|
E. Bertini, M. Correll, S. Franconeri
|
2020
|
View Paper |
An Examination of Grouping and Spatial Organization Tasks for High-Dimensional Data Exploration
|
John E. Wenskovitch, Chris North
|
2020
|
View Paper |
What Makes a Data-GIF Understandable?
|
Xinhuan Shu, Aoyu Wu, Junxiu Tang, B. Bach, Yingcai Wu, Huamin Qu
|
2020
|
View Paper |
Using Information Visualization to Promote Students' Reflection on "Gaming the System" in Online Learning
|
Meng Xia, Yuya Asano, J. Williams, Huamin Qu, Xiaojuan Ma
|
2020
|
View Paper |
Learning Machine Learning with Personal Data Helps Stakeholders Ground Advocacy Arguments in Model Mechanics
|
Yim Register, Amy J. Ko
|
2020
|
View Paper |
Privacy‐Preserving Data Visualization: Reflections on the State of the Art and Research Opportunities
|
Kaustav Bhattacharjee, Min Chen, Aritra Dasgupta
|
2020
|
View Paper |
Guidelines For Pursuing and Revealing Data Abstractions
|
Alex Bigelow, Katy Williams, Kate Isaacs
|
2020
|
View Paper |
From Access to Effective Use: Open Data Portals for Everyday Citizens
|
Unisse C. Chua, Kyle L. Santiago, Ian Benedict M. Ona, Romeo Manuel N. Peña, Geremiah Zachary S. Marasigan, Paolo Gabriel A. Delos Reyes, B. Samson
|
2020
|
View Paper |
Divining Insights: Visual Analytics Through Cartomancy
|
A. Mcnutt, Anamaria Crisan, M. Correll
|
2020
|
View Paper |
Addressing Cognitive and Emotional Barriers in Parent-Clinician Communication through Behavioral Visualization Webtools
|
H. Kong, Karrie Karahalios
|
2020
|
View Paper |
VisuaLint: Sketchy In Situ Annotations of Chart Construction Errors
|
Aspen K. Hopkins, M. Correll, Arvind Satyanarayan
|
2020
|
View Paper |
Design Study "Lite" Methodology: Expediting Design Studies and Enabling the Synergy of Visualization Pedagogy and Social Good
|
Uzma Haque Syeda, Prasanth Murali, L. Roe, B. Berkey, M. Borkin
|
2020
|
View Paper |
Pushing the (Visual) Narrative: The Effects of Prior Knowledge Elicitation in Provocative Topics
|
Jeremy Heyer, Nirmal Kumar Raveendranath, K. Reda
|
2020
|
View Paper |
Promoting data literacy in brazilian schools
|
A. Vivacqua, Angélica F. S. Dias, Juliana B. S. França
|
2019
|
View Paper |
"Customization is Key": Four Characteristics of Textual Affordances for Accessible Data Visualization
|
Shuli Jones, Isabella Pedraza Pineros, Daniel Hajas, Jonathan Zong, Arvind Satyanarayan
|
2023
|
View Paper |
Reconsidering Representation in College Design Curricula
|
Dietmar Offenhuber, Joy Mountford
|
2023
|
View Paper |
On Metavisualization and Properties of Visualization
|
Jaya Sreevalsan-Nair
|
2023
|
View Paper |
Chating About Data - Interacting with Voice Interfaces to Engage with Election Panel Data
|
Bernhard Jordan
|
2023
|
View Paper |
Tell It Slant: Investigating the Engagement, Discourse, and Popularity of Data Visualization in Online Communities
|
Emma Baker
|
2022
|
View Paper |
A proposal to measure the understanding of data visualization elements in visual analytics applications (Short paper)
|
Andrea Vázquez-Ingelmo, F. García-Peñalvo, Roberto Therón, Vetria L. Byrd, J. Camba
|
2022
|
View Paper |
Visualization Literacy in the Age of Big Data: Vital Skills for Modern Media Consumption
|
Mara Solen
|
2021
|
View Paper |
The Unfortunate Fringes of Visualization Literacy
|
Mara Solen
|
2021
|
View Paper |
International Journal of Human - Computer Studies
|
Muna Alebri, Enrico Costanza, Georgia Panagiotidou, Duncan P. Brumby, Fatima Althani, Riccardo Bovo
|
View Paper | |
Visualizing stories of sexual harassment in the academy: Visualizing stories of sexual harassment in the academy: Community empowerment through qualitative data Community empowerment through qualitative data
|
Tommaso Elli, A. Bradley, Uta Hinrichs, Christopher Collins
|
View Paper | |
: Exploring People’s Reasoning for Choosing Color Palettes
|
Jarryullah Ahmad, Elaine Huynh, ‡. FannyChevalier
|
View Paper |
Comments (0)