Data Mining and Visualization to Understand Accident-prone Areas

PDF

Publication

Published: Mar 22, 2021
Categories: cs.CY, cs.LG

Metrics

Source: ArXiv

Quick Actions

View PDF

AI Quick Summary

This paper uses data mining and visualization to identify accident-prone areas, times, and days, finding that most accidents occur in the evening on Fridays and in October. Survey results indicate effective visualization techniques for non-expert users.

Paper Preview

Abstract

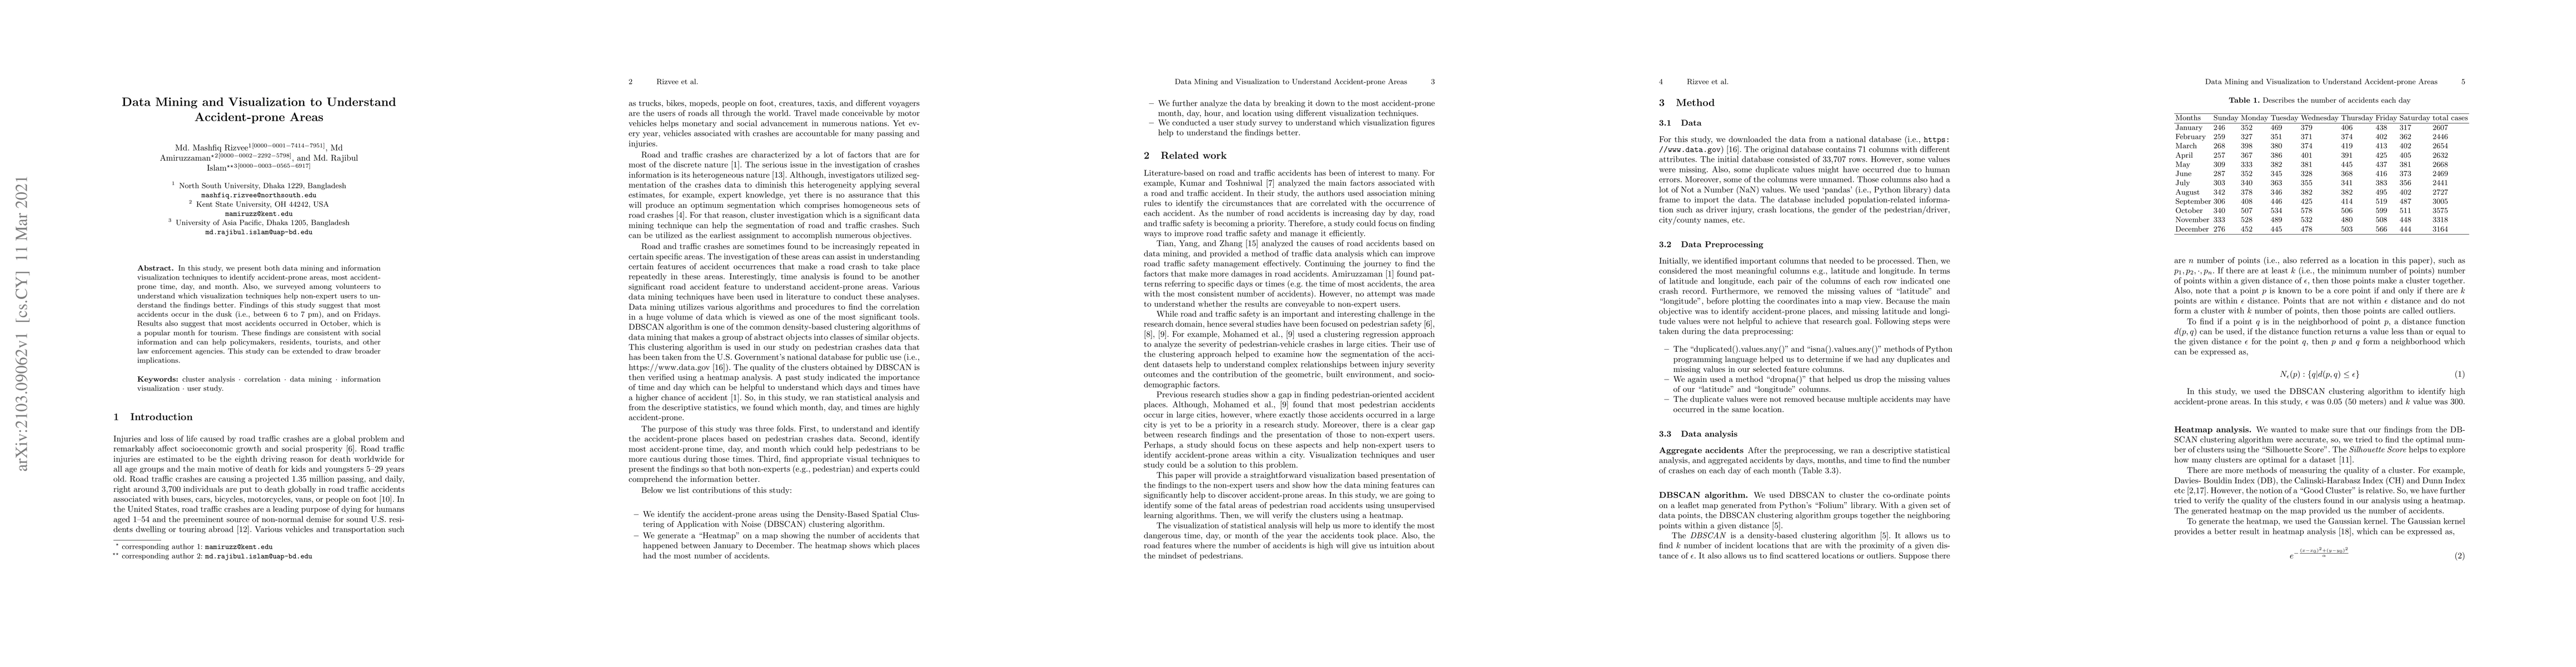
In this study, we present both data mining and information visualization techniques to identify accident-prone areas, most accident-prone time, day, and month. Also, we surveyed among volunteers to understand which visualization techniques help non-expert users to understand the findings better. Findings of this study suggest that most accidents occur in the dusk (i.e., between 6 to 7 pm), and on Fridays. Results also suggest that most accidents occurred in October, which is a popular month for tourism. These findings are consistent with social information and can help policymakers, residents, tourists, and other law enforcement agencies. This study can be extended to draw broader implications.

AI Key Findings

Get AI-generated insights about this paper's methodology, results, and significance.

Paper Details

Paper ID: 2103.09062
Journal: Proceedings of International Joint Conference on Advances in Computational Intelligence 2020
License: http://arxiv.org/licenses/nonexclusive-distrib/1.0/
Comments: 8 figures, 1 table
Categories:
cs.CY cs.LG

How to Cite This Paper

BibTeX
@article{amiruzzaman2021data,
  title         = {Data Mining and Visualization to Understand Accident-prone Areas},
  author        = {Amiruzzaman, Md and Rizvee, Md Mashfiq and Islam, Md Rajibul},
  year          = {2021},
  eprint        = {2103.09062},
  archivePrefix = {arXiv},
  primaryClass  = {cs.CY},
  doi           = {10.1007/978-981-16-0586-4_12},
}
APA 7
Amiruzzaman, M., Rizvee, M., & Islam, M. (2021). Data Mining and Visualization to Understand Accident-prone Areas. arXiv. https://doi.org/10.1007/978-981-16-0586-4_12
MLA 9
Amiruzzaman, Md, et al. "Data Mining and Visualization to Understand Accident-prone Areas." arXiv, 2021, doi.org/10.1007/978-981-16-0586-4_12.

Key Terms

prone (0.337)
findings (0.293)
help (0.249)
understand (0.245)
suggest (0.224)
techniques (0.205)
occurred (0.199)
draw (0.197)

Citation Network

Current paper (gray), citations (green), references (blue)

Display is limited for performance on very large graphs.

Current Paper
Citations
References
Click to view

Similar Papers

Found 4 papers

Does visualization help AI understand data?

Victoria R. Li, Johnathan Sun, Martin Wattenberg

2025-07-24

Sensing accident-prone features in urban scenes for proactive driving and accident prevention

Sumit Mishra, Praveen Kumar Rajendran, Luiz Felipe Vecchietti et al.

2022-11-21

Do Large Language Models Understand Data Visualization Principles?

Martin Sinnona, Valentin Bonas, Viviana Siless et al.

2026-02-23
Title Authors Year Actions

Comments (0)

This website uses cookies to ensure you get the best experience. Learn more