Data Poisoning Attacks to Local Differential Privacy Protocols for Graphs
Publication
Metrics
AI Quick Summary
This paper investigates data poisoning attacks on Local Differential Privacy (LDP) protocols designed for graph analysis, demonstrating that attackers can inject fake data to degrade metrics like degree centrality and clustering coefficient. The study proposes three specific attacks and two countermeasures, but shows that these defenses are insufficient, emphasizing the need for advanced security measures.
Paper Preview
Abstract
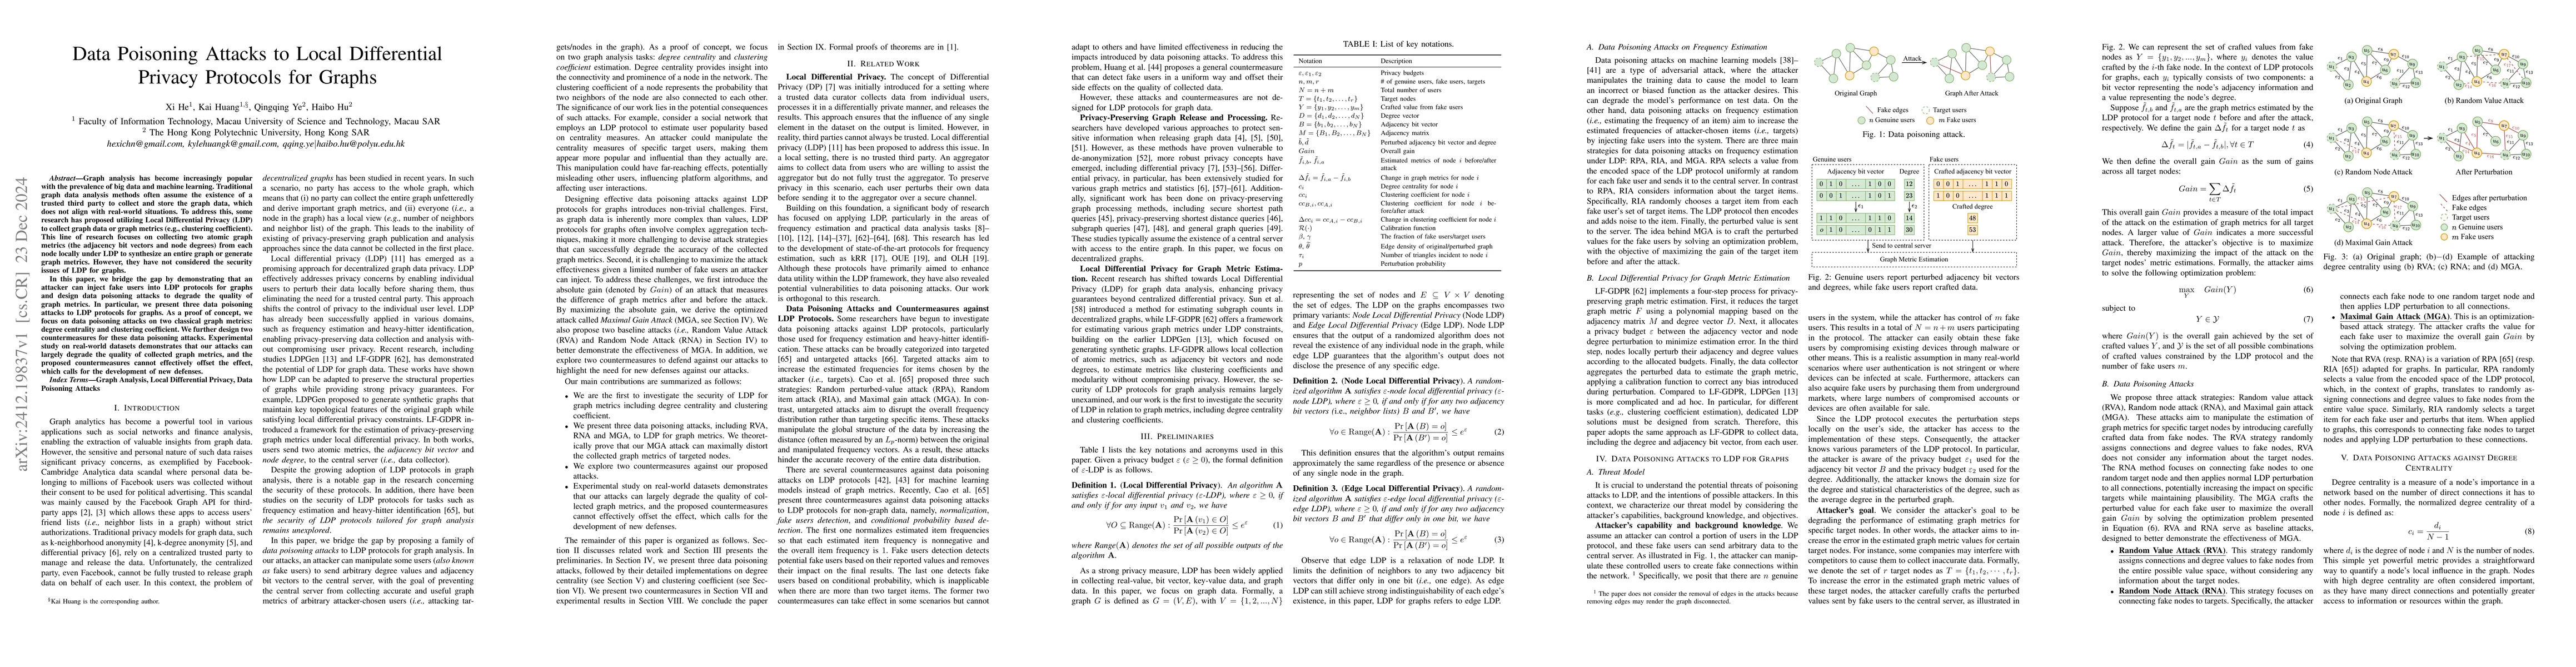
Graph analysis has become increasingly popular with the prevalence of big data and machine learning. Traditional graph data analysis methods often assume the existence of a trusted third party to collect and store the graph data, which does not align with real-world situations. To address this, some research has proposed utilizing Local Differential Privacy (LDP) to collect graph data or graph metrics (e.g., clustering coefficient). This line of research focuses on collecting two atomic graph metrics (the adjacency bit vectors and node degrees) from each node locally under LDP to synthesize an entire graph or generate graph metrics. However, they have not considered the security issues of LDP for graphs. In this paper, we bridge the gap by demonstrating that an attacker can inject fake users into LDP protocols for graphs and design data poisoning attacks to degrade the quality of graph metrics. In particular, we present three data poisoning attacks to LDP protocols for graphs. As a proof of concept, we focus on data poisoning attacks on two classical graph metrics: degree centrality and clustering coefficient. We further design two countermeasures for these data poisoning attacks. Experimental study on real-world datasets demonstrates that our attacks can largely degrade the quality of collected graph metrics, and the proposed countermeasures cannot effectively offset the effect, which calls for the development of new defenses.
AI Key Findings
Get AI-generated insights about this paper's methodology, results, significance, and more — seven facets brought into focus.
Impact
Authors
PDF Preview
Citation Network
Current paper (gray), citations (green), references (blue)
Display is limited for performance on very large graphs.
Discussion 0