Dataset Cartography: Mapping and Diagnosing Datasets with Training Dynamics
Publication
Metrics
AI Quick Summary
This research paper introduces a new tool called Data Maps to diagnose dataset quality, revealing three distinct regions in data with different characteristics that can improve model performance and generalization.
Paper Preview
Abstract
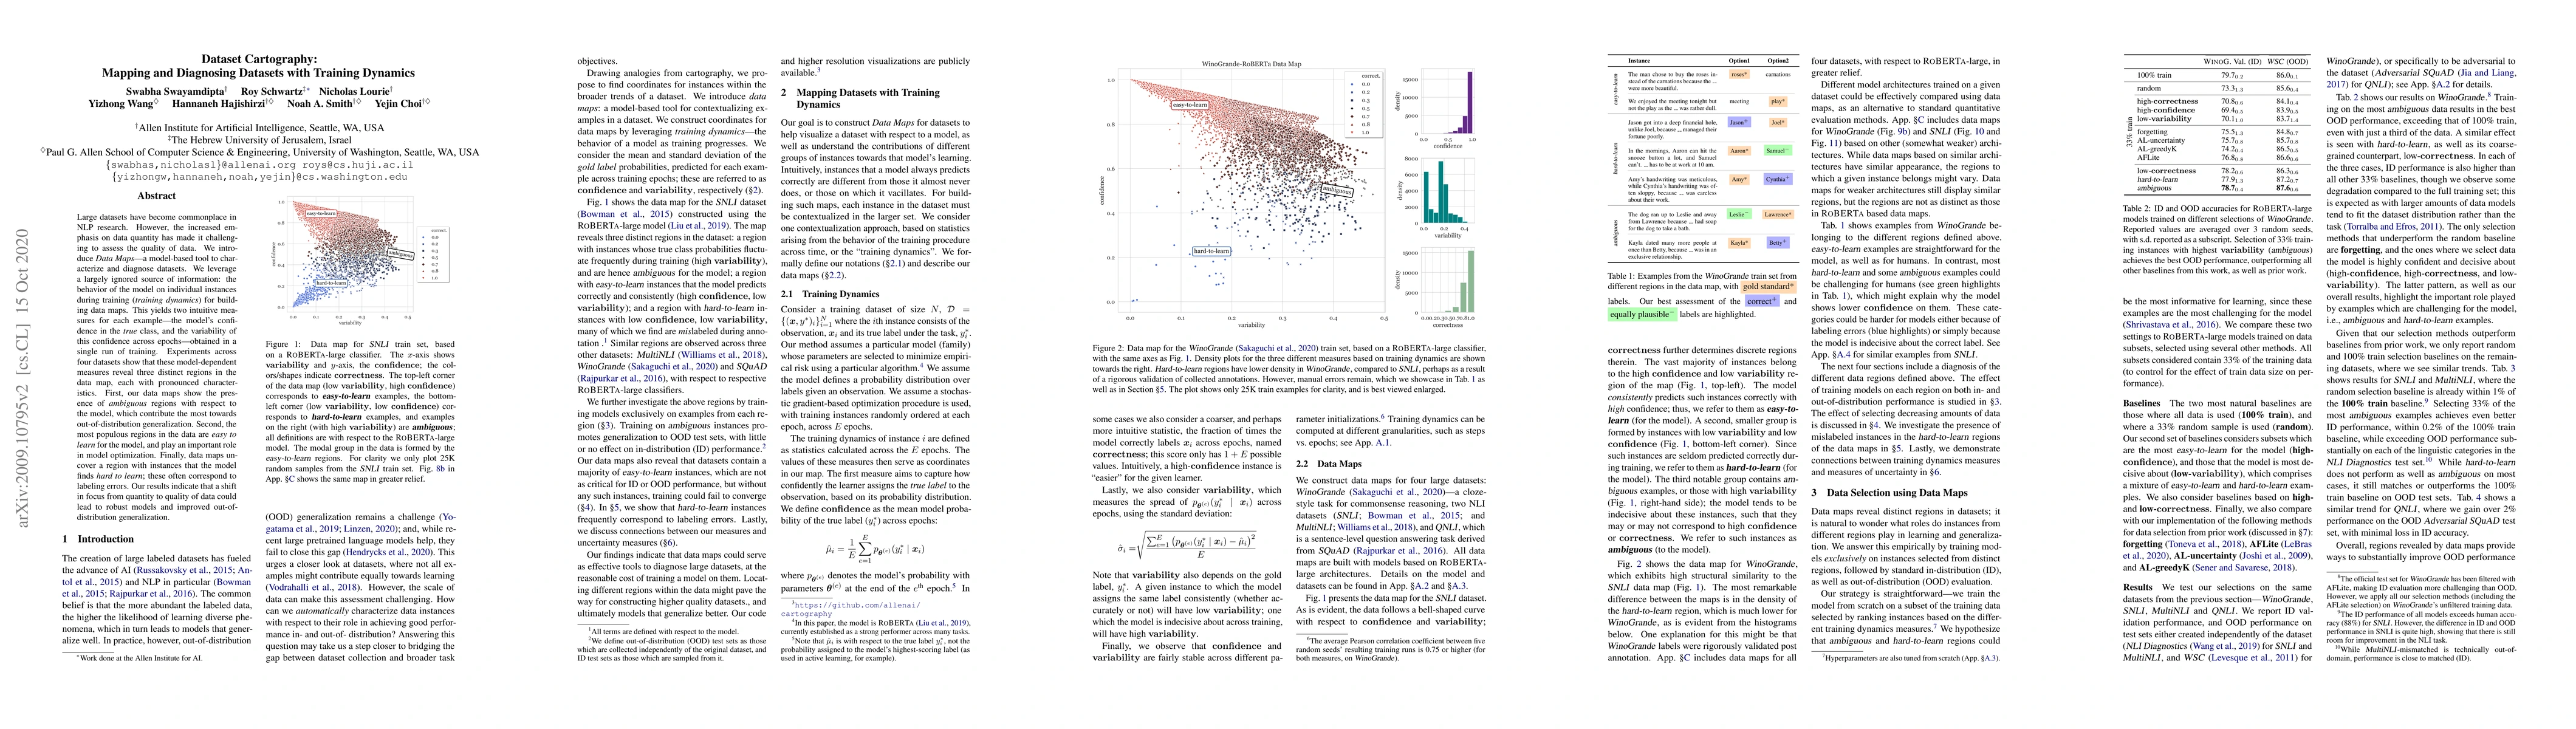
Large datasets have become commonplace in NLP research. However, the increased emphasis on data quantity has made it challenging to assess the quality of data. We introduce Data Maps---a model-based tool to characterize and diagnose datasets. We leverage a largely ignored source of information: the behavior of the model on individual instances during training (training dynamics) for building data maps. This yields two intuitive measures for each example---the model's confidence in the true class, and the variability of this confidence across epochs---obtained in a single run of training. Experiments across four datasets show that these model-dependent measures reveal three distinct regions in the data map, each with pronounced characteristics. First, our data maps show the presence of "ambiguous" regions with respect to the model, which contribute the most towards out-of-distribution generalization. Second, the most populous regions in the data are "easy to learn" for the model, and play an important role in model optimization. Finally, data maps uncover a region with instances that the model finds "hard to learn"; these often correspond to labeling errors. Our results indicate that a shift in focus from quantity to quality of data could lead to robust models and improved out-of-distribution generalization.
AI Key Findings
Get AI-generated insights about this paper's methodology, results, significance, and more — seven facets brought into focus.
Impact
Paper Details
PDF Preview
Key Terms
Citation Network
Current paper (gray), citations (green), references (blue)
Display is limited for performance on very large graphs.
Discussion 0