Data+Shift: Supporting visual investigation of data distribution shifts by data scientists
Publication
Metrics
AI Quick Summary
Data+Shift is a visual analytics tool designed to assist data scientists in investigating data distribution shifts, particularly in fraud detection. It integrates with JupyterLab and was validated through a think-aloud experiment, demonstrating its effectiveness in diagnosing data drift causes.
Paper Preview
Abstract
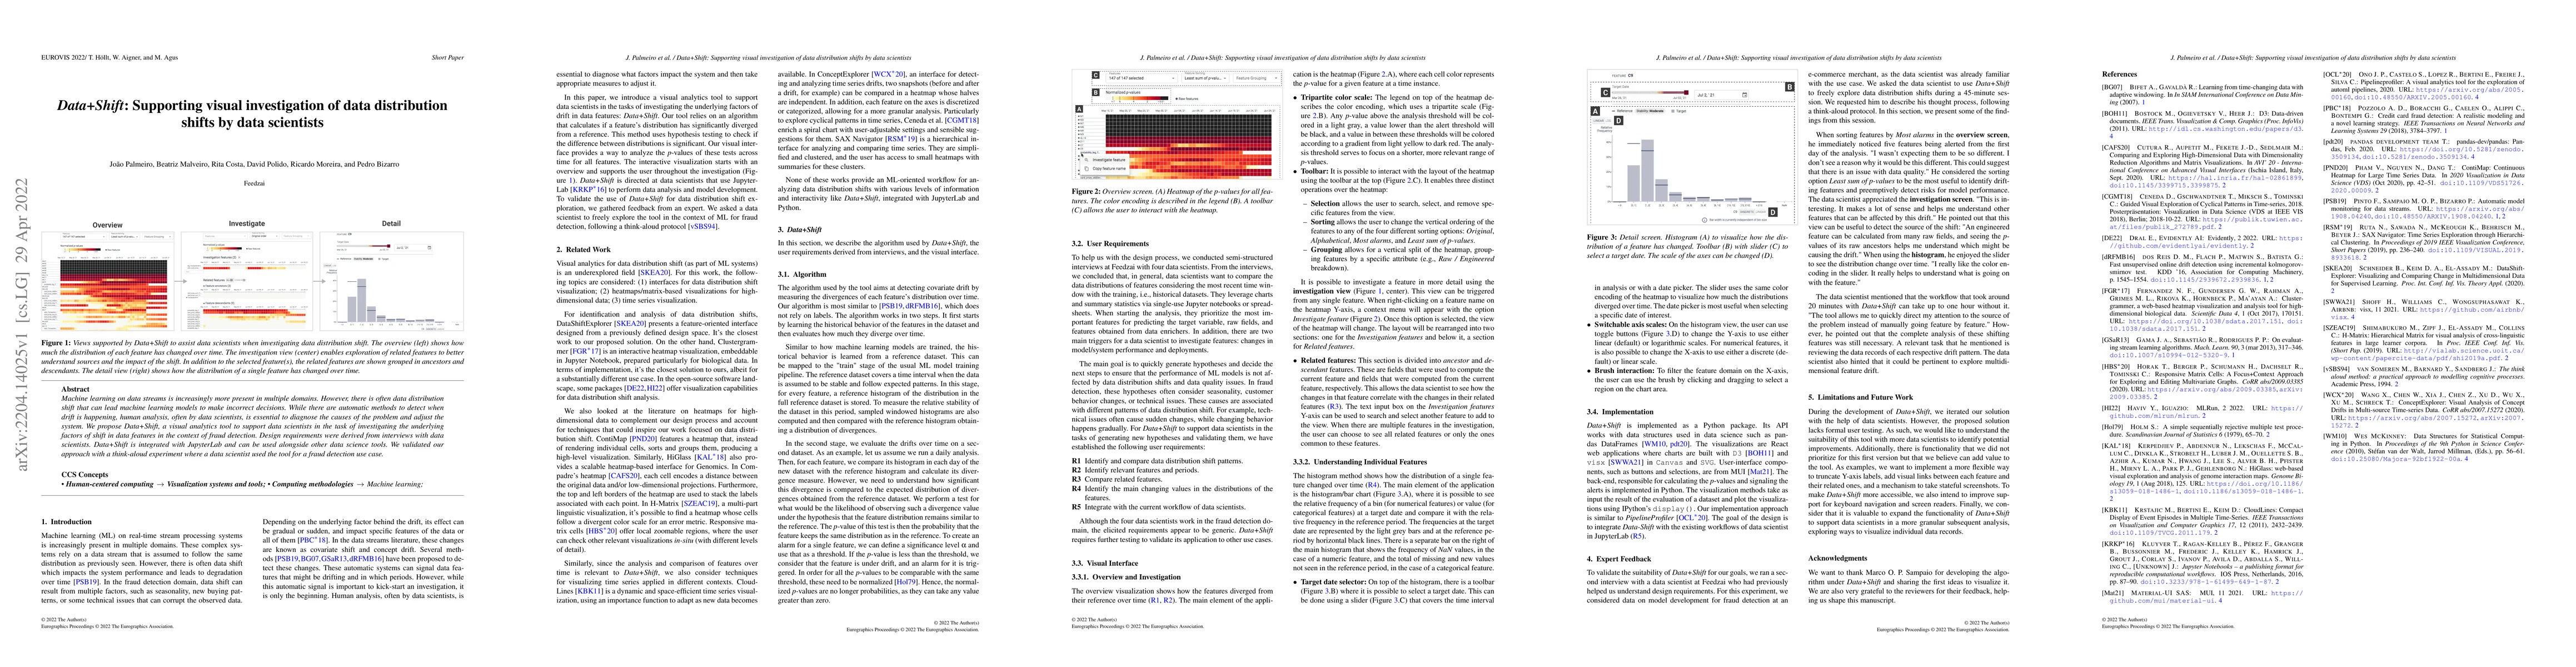
Machine learning on data streams is increasingly more present in multiple domains. However, there is often data distribution shift that can lead machine learning models to make incorrect decisions. While there are automatic methods to detect when drift is happening, human analysis, often by data scientists, is essential to diagnose the causes of the problem and adjust the system. We propose Data+Shift, a visual analytics tool to support data scientists in the task of investigating the underlying factors of shift in data features in the context of fraud detection. Design requirements were derived from interviews with data scientists. Data+Shift is integrated with JupyterLab and can be used alongside other data science tools. We validated our approach with a think-aloud experiment where a data scientist used the tool for a fraud detection use case.
AI Key Findings
Get AI-generated insights about this paper's methodology, results, significance, and more — seven facets brought into focus.
Impact
Paper Details
Authors
PDF Preview
Key Terms
Citation Network
Current paper (gray), citations (green), references (blue)
Display is limited for performance on very large graphs.
Discussion 0