Deconfusing the Confusogram: Getting New Insights from Zeeman Doppler Imaging

Source: ArXiv

AI Quick Summary

This research introduces a new method to visualize Zeeman Doppler Imaging (ZDI) results for multiple stars, improving upon the traditional 'confusogram'. The method facilitates understanding magnetic field strengths and topologies, and it also allows for the analysis of variability in these fields through repeated observations, as demonstrated using M dwarf data.

Share: Share on X LinkedIn

Summary

Zeeman Doppler Imaging is a powerful tool for characterizing the strength and topology of stellar magnetic fields. In this research note, we present a new way to visualize the typical results from ZDI for an ensemble of stars, addressing some of the concerns with the standard `confusogram' approach to illustrating the data. Our publically available plotting methods further enable an accessible means to consider variability in the inferred magnetic field topologies from repeated observations, as we demonstrate with the literature ZDI data on M dwarfs.

AI Key Findings

Generated Sep 03, 2025

Methodology

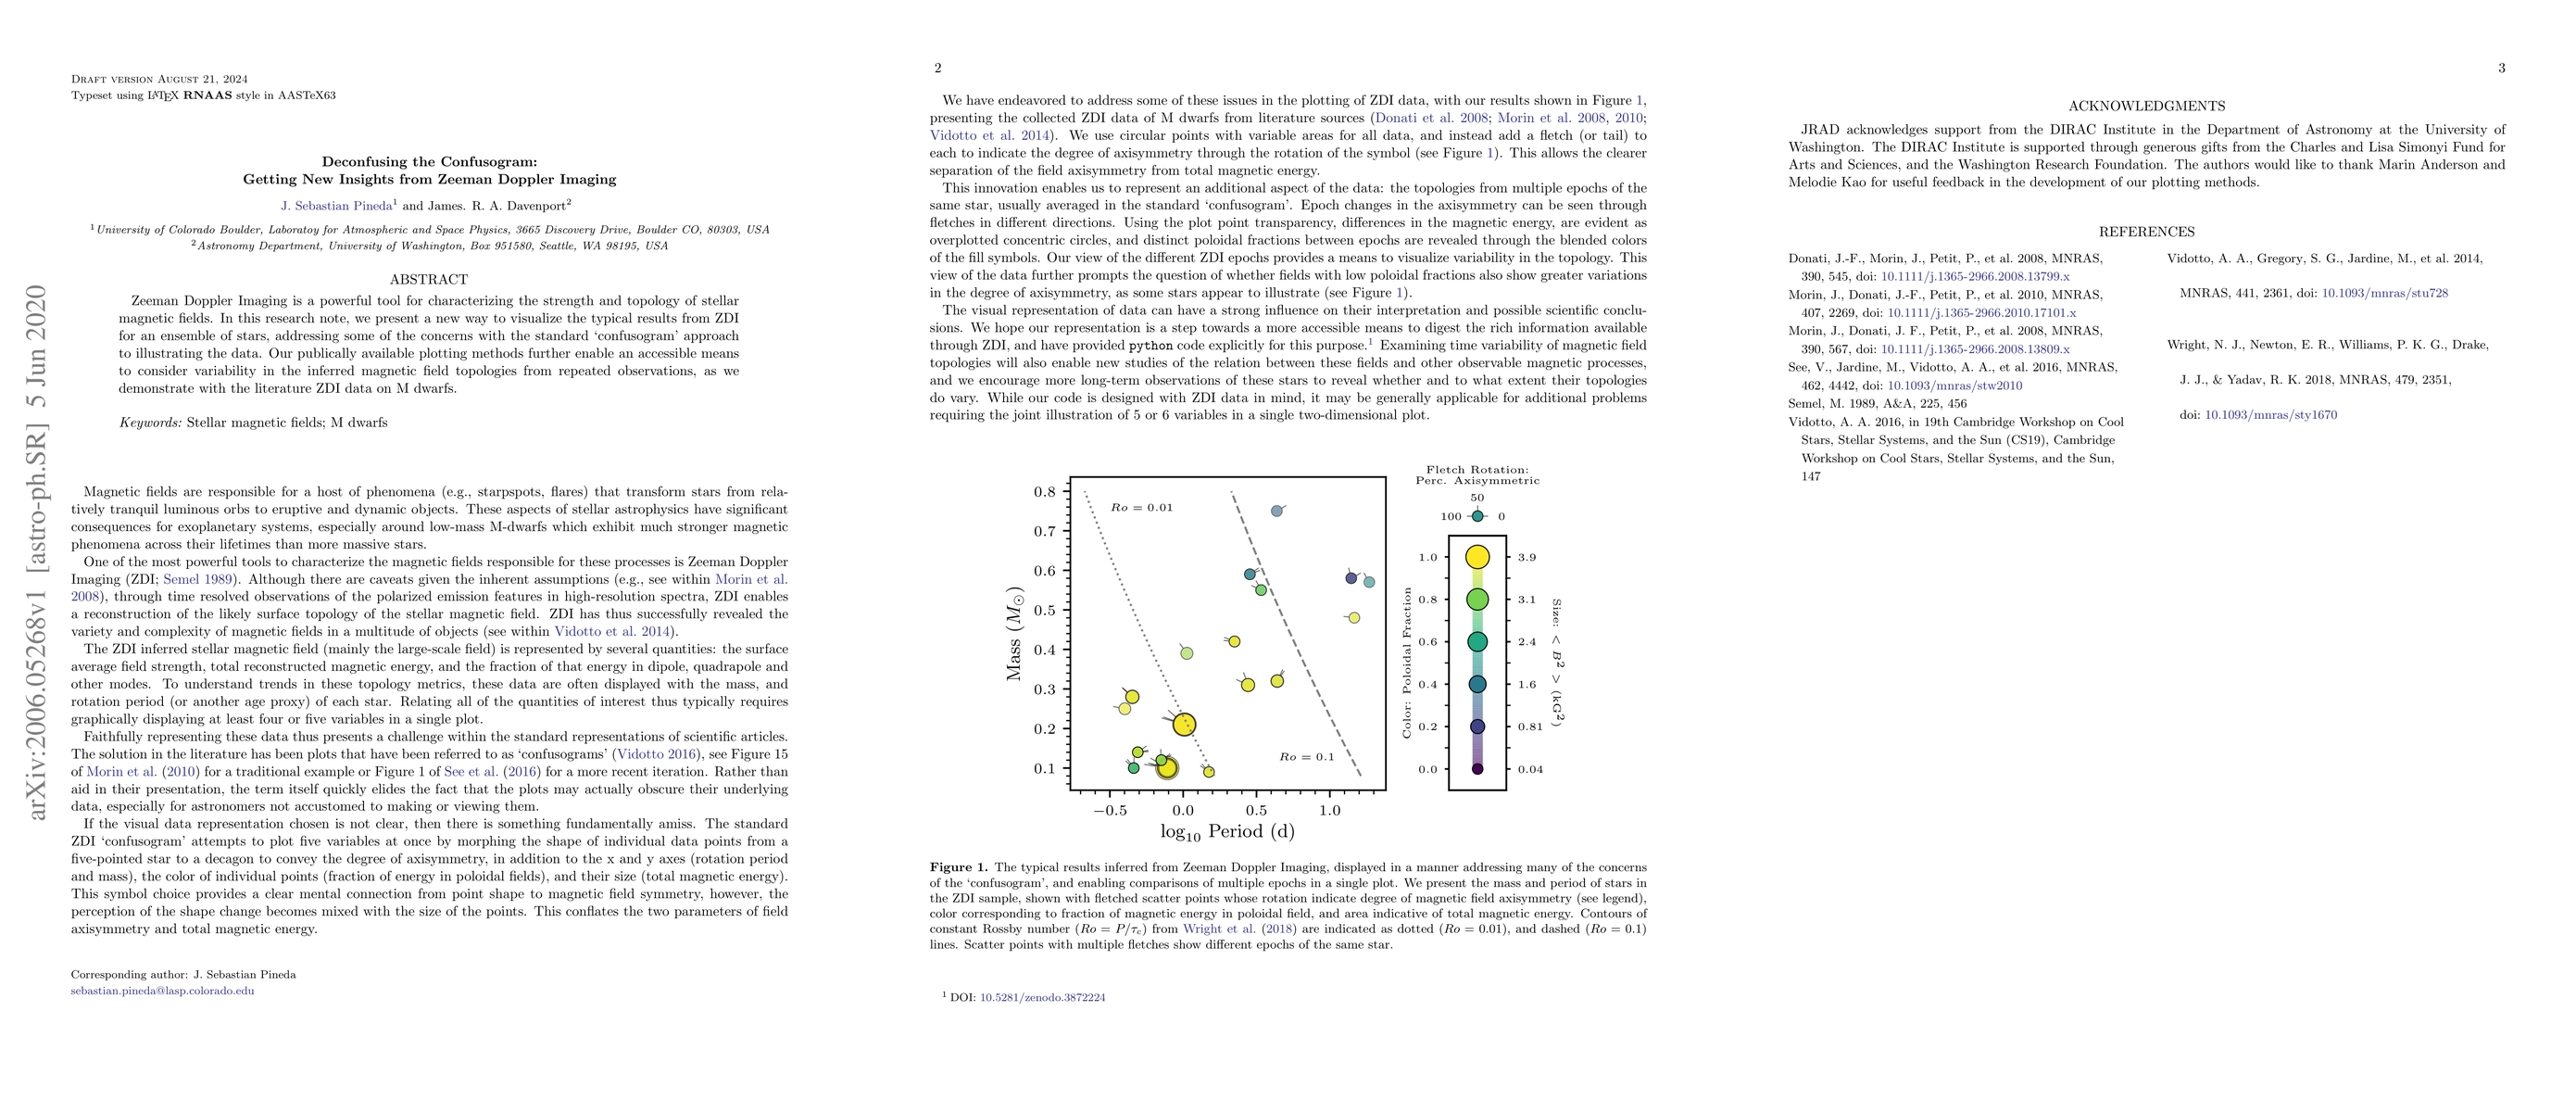
The research introduces new plotting methods for Zeeman Doppler Imaging (ZDI) data, addressing concerns with the standard 'confusogram' approach. These methods enable visualization of magnetic field topologies from repeated observations of stars, facilitating the study of variability.

Key Results

  • Presented a novel way to visualize ZDI results for an ensemble of stars, separating field axisymmetry from total magnetic energy.
  • Demonstrated the use of these methods with literature ZDI data on M dwarfs, visualizing epoch changes in axisymmetry and magnetic energy differences.
  • Highlighted the potential for studying the relationship between magnetic fields and other magnetic processes, encouraging long-term observations to reveal field topology variations.

Significance

This research is important as it enhances the accessibility and clarity of ZDI data, which is crucial for understanding stellar magnetic phenomena, especially around low-mass M-dwarfs. Improved visualization can lead to better insights into exoplanetary systems.

Technical Contribution

The main technical contribution is the development of new plotting methods that clearly separate field axisymmetry from total magnetic energy in ZDI data, enabling better visualization and interpretation of magnetic field topologies.

Novelty

This research offers a novel approach to visualizing ZDI data, addressing the limitations of the traditional 'confusogram' method and providing a more accessible means to study magnetic field variability in stellar ensembles.

Limitations

  • The study is limited to the application of new plotting methods on existing ZDI data, and further observations are needed to validate long-term magnetic field variability.
  • The methods may not be universally applicable to all types of stellar magnetic field data without modifications.

Future Work

  • Expand the use of these plotting methods to other stellar magnetic field datasets for broader applicability.
  • Conduct long-term observations to validate the variability insights gained from the new visualization techniques.

Paper Details

PDF Preview

Download PDF

Key Terms

doppler (0.218)
doppler (0.214)
repeated (0.213)
topologies (0.210)
powerful tool (0.206)
topologies (0.205)
magnetic (0.201)
dwarfs (0.200)

Citation Network

Current paper (gray), citations (green), references (blue)

Display is limited for performance on very large graphs.

Current Paper
Citations
References
Click to view

No citations found for this paper.

Comments (0)

This website uses cookies to ensure you get the best experience. Learn more