Deep learning-based classification of breast cancer molecular subtypes from H&E whole-slide images
Publication
Metrics
AI Quick Summary
This research investigates the use of deep learning on H&E-stained whole-slide images (WSIs) to classify breast cancer molecular subtypes, achieving a macro F1 score of 0.73 for subtyping. The study proposes a two-step pipeline involving tumor region identification and an OvR strategy enhanced by XGBoost, suggesting potential for cost-effective, accessible molecular subtyping.
Paper Preview
Abstract
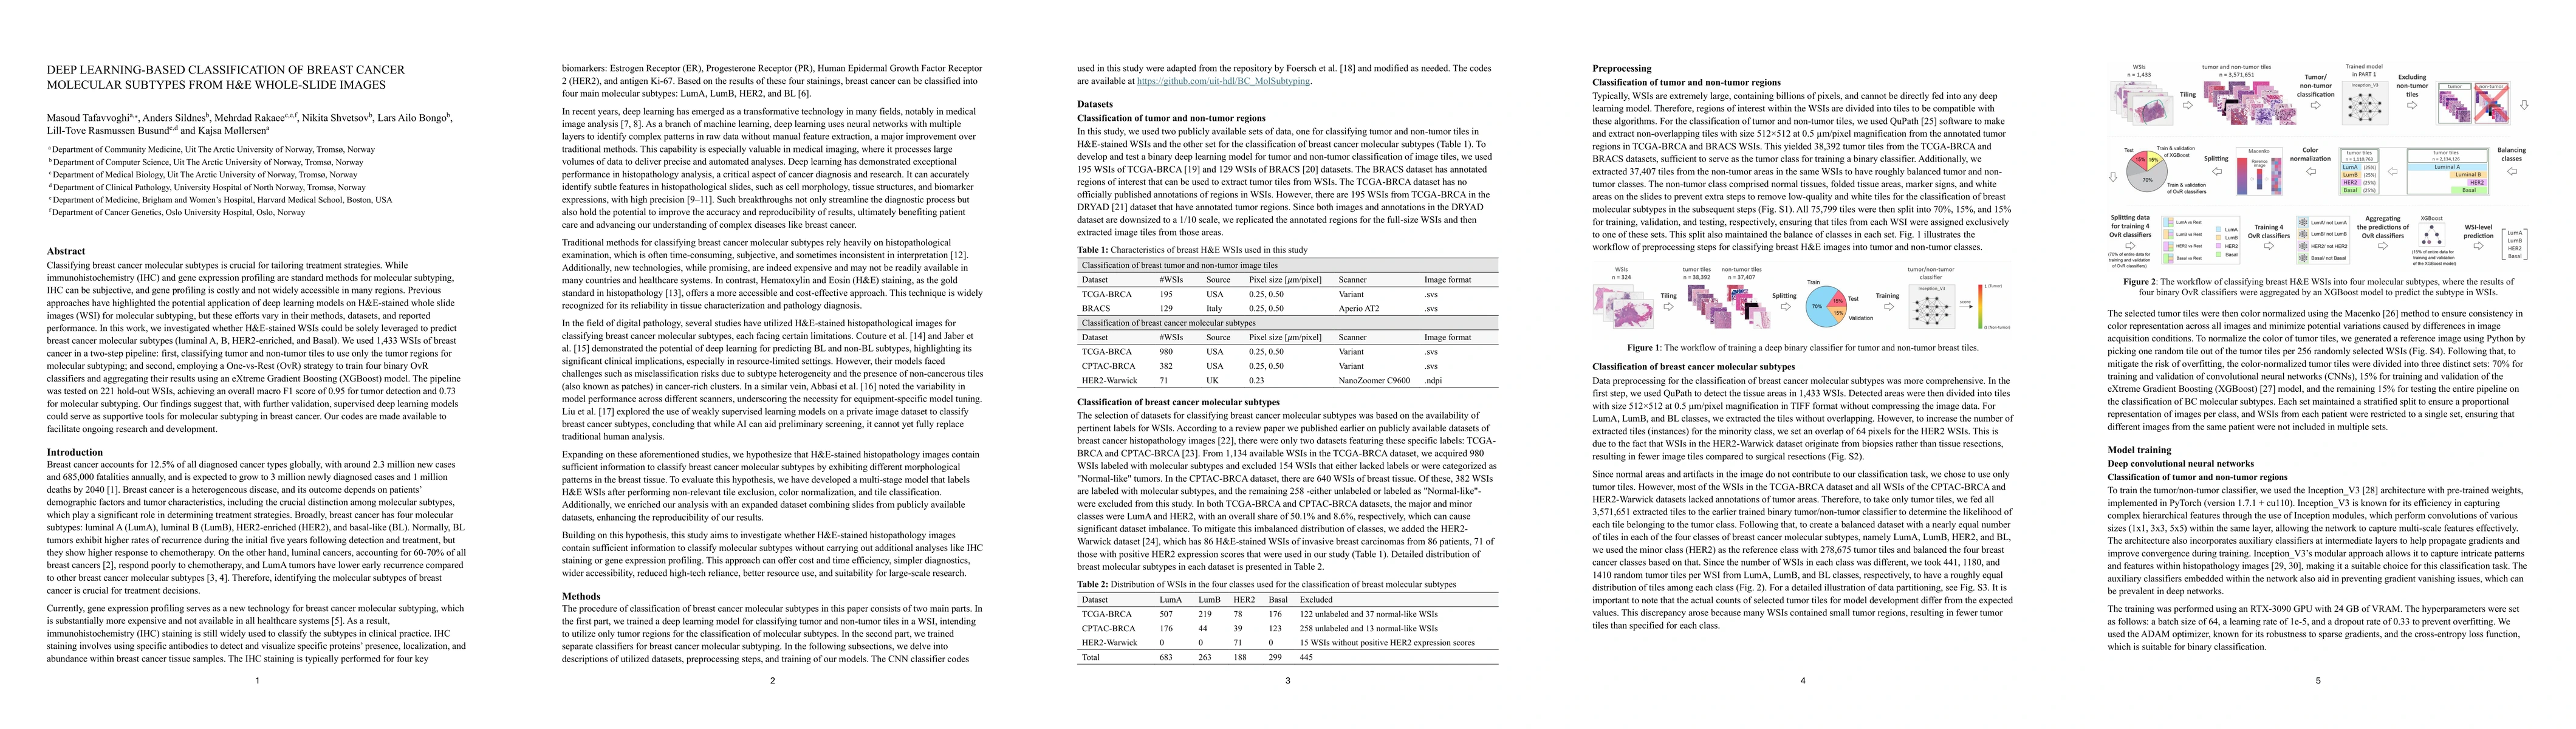
Classifying breast cancer molecular subtypes is crucial for tailoring treatment strategies. While immunohistochemistry (IHC) and gene expression profiling are standard methods for molecular subtyping, IHC can be subjective, and gene profiling is costly and not widely accessible in many regions. Previous approaches have highlighted the potential application of deep learning models on H&E-stained whole slide images (WSI) for molecular subtyping, but these efforts vary in their methods, datasets, and reported performance. In this work, we investigated whether H&E-stained WSIs could be solely leveraged to predict breast cancer molecular subtypes (luminal A, B, HER2-enriched, and Basal). We used 1,433 WSIs of breast cancer in a two-step pipeline: first, classifying tumor and non-tumor tiles to use only the tumor regions for molecular subtyping; and second, employing a One-vs-Rest (OvR) strategy to train four binary OvR classifiers and aggregating their results using an eXtreme Gradient Boosting (XGBoost) model. The pipeline was tested on 221 hold-out WSIs, achieving an overall macro F1 score of 0.95 for tumor detection and 0.73 for molecular subtyping. Our findings suggest that, with further validation, supervised deep learning models could serve as supportive tools for molecular subtyping in breast cancer. Our codes are made available to facilitate ongoing research and development.
AI Key Findings
Get AI-generated insights about this paper's methodology, results, significance, and more — seven facets brought into focus.
Impact
Paper Details
Authors
PDF Preview
Citation Network
Current paper (gray), citations (green), references (blue)
Display is limited for performance on very large graphs.
Discussion 0