Deep Models for Visual Sentiment Analysis of Disaster-related Multimedia Content
Publication
Metrics
AI Quick Summary
This paper proposes deep learning models, specifically Inception-v3 and VggNet-19, to analyze and classify sentiments in natural disaster-related images from social media. The models achieved encouraging results across three sub-tasks, with weighted F1-scores ranging from 0.495 to 0.584.
Paper Preview
Abstract
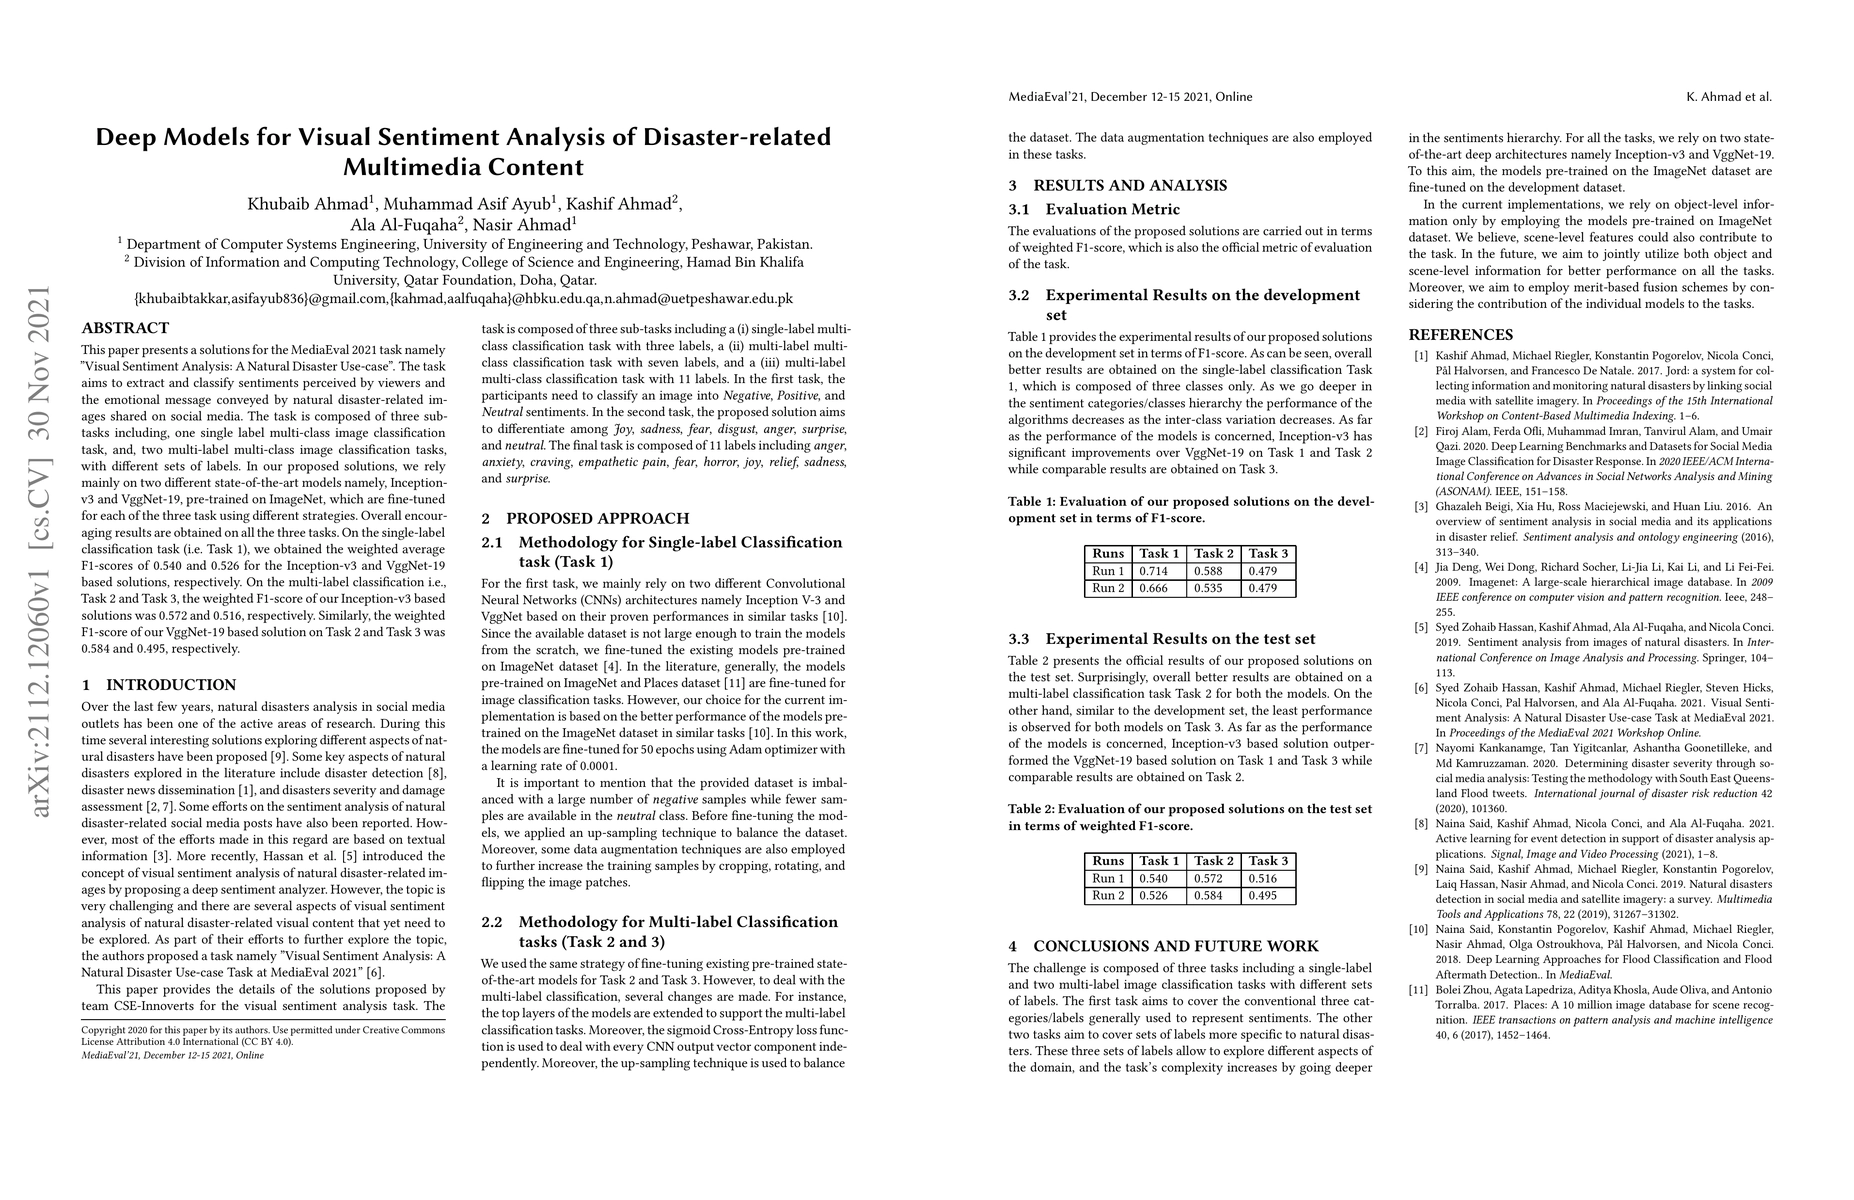
This paper presents a solutions for the MediaEval 2021 task namely "Visual Sentiment Analysis: A Natural Disaster Use-case". The task aims to extract and classify sentiments perceived by viewers and the emotional message conveyed by natural disaster-related images shared on social media. The task is composed of three sub-tasks including, one single label multi-class image classification task, and, two multi-label multi-class image classification tasks, with different sets of labels. In our proposed solutions, we rely mainly on two different state-of-the-art models namely, Inception-v3 and VggNet-19, pre-trained on ImageNet, which are fine-tuned for each of the three task using different strategies. Overall encouraging results are obtained on all the three tasks. On the single-label classification task (i.e. Task 1), we obtained the weighted average F1-scores of 0.540 and 0.526 for the Inception-v3 and VggNet-19 based solutions, respectively. On the multi-label classification i.e., Task 2 and Task 3, the weighted F1-score of our Inception-v3 based solutions was 0.572 and 0.516, respectively. Similarly, the weighted F1-score of our VggNet-19 based solution on Task 2 and Task 3 was 0.584 and 0.495, respectively.
AI Key Findings
Get AI-generated insights about this paper's methodology, results, significance, and more — seven facets brought into focus.
Impact
Paper Details
Authors
PDF Preview
Key Terms
Citation Network
Current paper (gray), citations (green), references (blue)
Display is limited for performance on very large graphs.
Discussion 0