ArxivLens

Quick Summary:

This paper investigates $\Delta\eta$-$\Delta\phi$ correlations in STAR's high $p_{T}$ di-hadron studies in central Au+Au collisions, revealing a ridge-like structure. The study extends to inclusive un-triggered correlations and models the evolution of these correlations, attributing the observed ridge to initial state fluctuations and comparing results with p+p data.

DOI: 10.1088/1742-6596/389/1/012039
arXiv Id: 1209.4941
Comments: 8 Pages, 7 Figures : Proceedings of the Winter Workshop in Nuclear Dynamics, Puerto Rico
Date Published: 2015-06-11
Date Updated: 2015-06-11

Categories:

Key Terms (TF-IDF):

p_ (0.308)
triggered (0.271)
hadron (0.245)
nn (0.225)
s_ (0.217)
au (0.209)
gev (0.205)
correlation (0.179)
sqrt (0.174)
structure (0.170)
evolution (0.165)
delta (0.160)
particles (0.148)
initial state (0.134)
v_ (0.132)
possible (0.122)
eta (0.120)
fluctuation (0.115)
modeled (0.115)
phi (0.113)
License: http://arxiv.org/licenses/nonexclusive-distrib/1.0/

Summary:

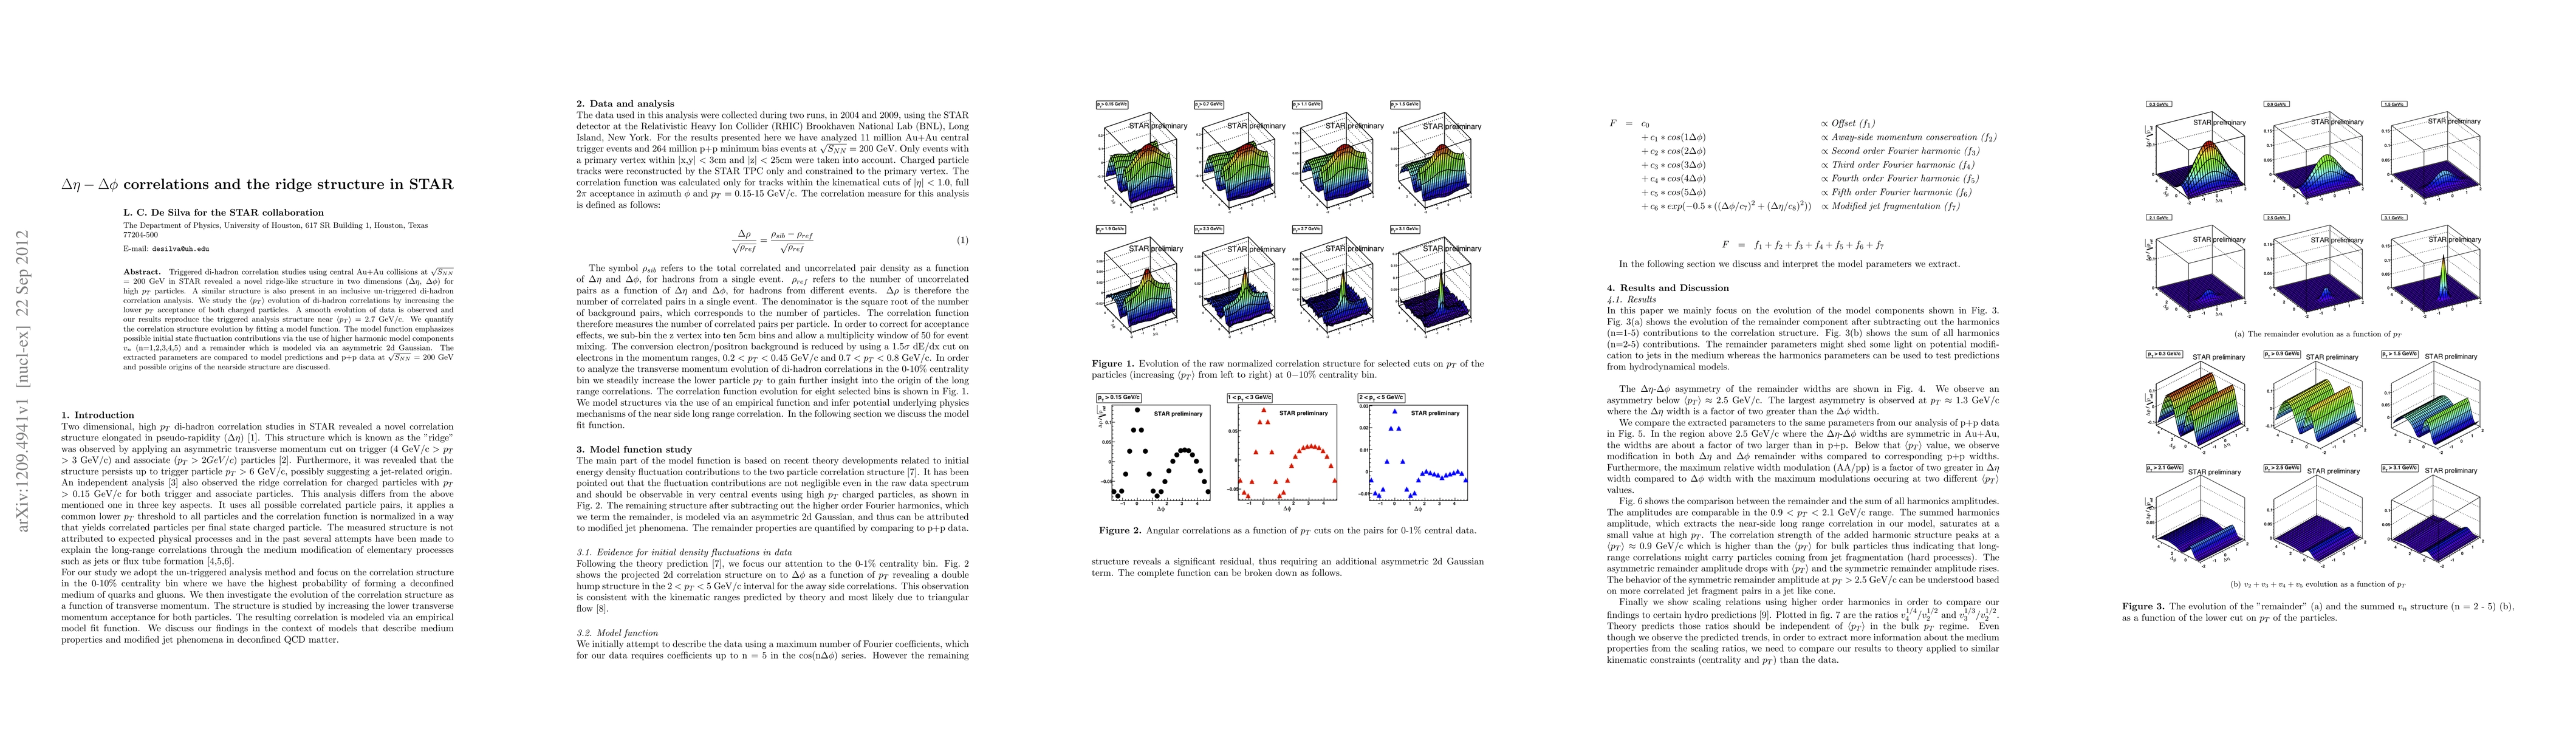
Triggered di-hadron correlation studies using central Au+Au collisions at $\sqrt{S_{NN}}$ = 200 GeV in STAR revealed a novel ridge-like structure in two dimensions ($\Delta\eta$,$\Delta\phi$) for high $p_{T}$ particles. A similar structure is also present in an inclusive un-triggered di-hadron correlation analysis. We study the <$p_{T}$> evolution of di-hadron correlations by increasing the lower $p_{T}$ acceptance of both charged particles. A smooth evolution of data is observed and our results reproduce the triggered analysis structure near = 2.7 GeV/c. We quantify the correlation structure evolution by fitting a model function. The model function emphasizes possible initial state fluctuation contributions via the use of higher harmonic model components $v_{n}$ (n=1,2,3,4,5) and a remainder which is modeled via an asymmetric 2d Gaussian. The extracted parameters are compared to model predictions and p+p data at $\sqrt{S_{NN}}$ = 200 GeV and possible origins of the nearside structure are discussed.

Citation & Reference Network Visualization

This graph shows how this paper is connected to other research. The current paper is shown in dark gray, papers that cite it are in green, and papers it references are in blue. You can:

Current Paper
Papers citing this work (Citations)
Papers cited by this work (References)

• Hover over any node to see the paper title

• Click a node to view that paper's details

• Drag nodes to rearrange the graph

• Use the zoom controls (bottom right) to zoom in/out

Citations and References

No citations found for this paper.

Comments (0)

This website uses cookies to ensure you get the best experience. Learn more