Demand for shared mobility to complement public transportation: Human driven and autonomous vehicles
Publication
Metrics
AI Quick Summary
This study explores how ride-sharing services, including human-driven and autonomous vehicles, can complement public transportation, particularly in low-density areas. Results from Oakville, Ontario, show a 76% increase in ridership and a 47% reduction in wait time with a 50% fare discount on shared autonomous vehicles.
Paper Preview
Abstract
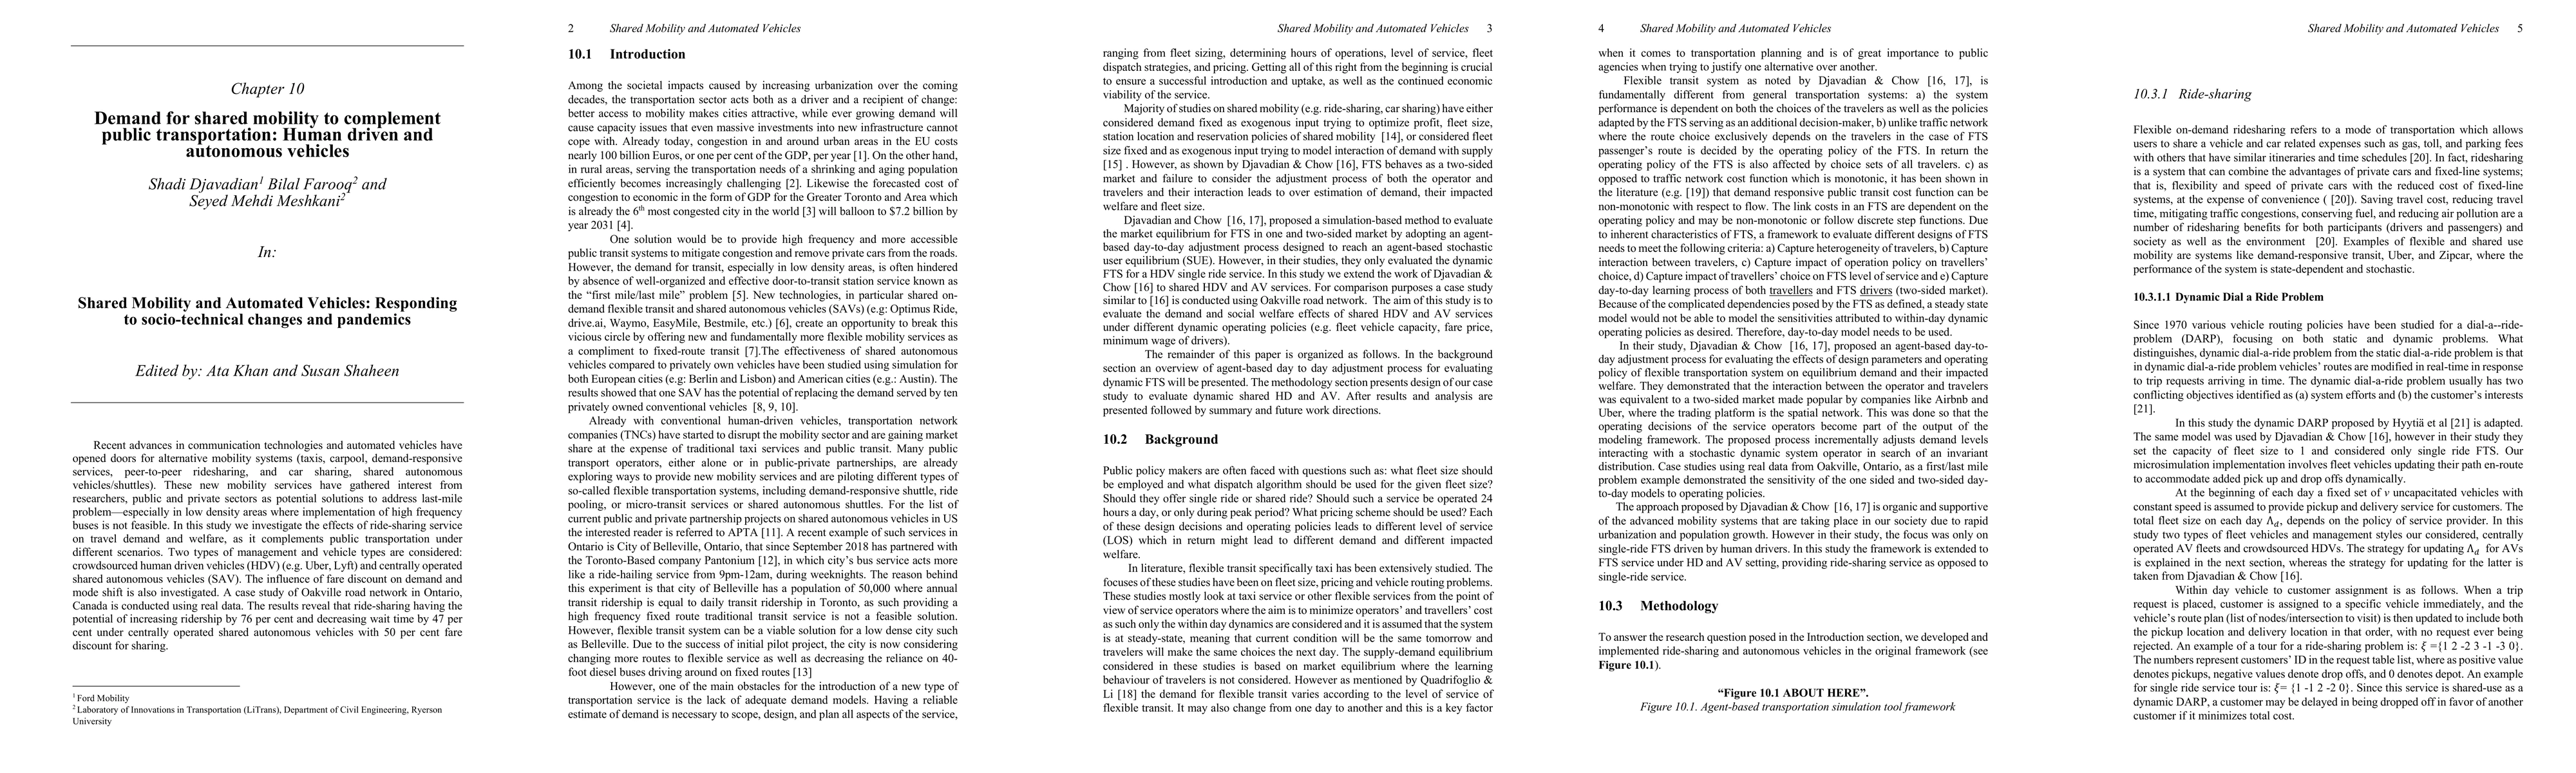
Recent advances in communication technologies and automated vehicles have opened doors for alternative mobility systems (taxis, carpool, demand-responsive services, peer-to-peer ridesharing, and car sharing, shared autonomous vehicles/shuttles). These new mobility services have gathered interest from researchers, public and private sectors as potential solutions to address last-mile problem--especially in low density areas where implementation of high frequency buses is not feasible. In this study we investigate the effects of ride-sharing service on travel demand and welfare, as it complements public transportation under different scenarios. Two types of management and vehicle types are considered: crowdsourced human driven vehicles (HDV) (e.g. Uber, Lyft) and centrally operated shared autonomous vehicles (SAV). The influence of fare discount on demand and mode shift is also investigated. A case study of Oakville road network in Ontario, Canada is conducted using real data. The results reveal that ride-sharing having the potential of increasing ridership by 76 per cent and decreasing wait time by 47 per cent under centrally operated shared autonomous vehicles with 50 per cent fare discount for sharing.
AI Key Findings
Get AI-generated insights about this paper's methodology, results, significance, and more — seven facets brought into focus.
Impact
Paper Details
Authors
PDF Preview
Key Terms
Citation Network
Current paper (gray), citations (green), references (blue)
Display is limited for performance on very large graphs.
Discussion 0