Demystifying Spatial Dependence: Interactive Visualizations for Interpreting Local Spatial Autocorrelation
Publication
Metrics
AI Quick Summary
This paper introduces three novel interactive visualizations to simplify the interpretation of Local Moran's I for spatial autocorrelation analysis. The visualizations are linked to provide a comprehensive exploration and are implemented in a JavaScript library with a web dashboard demonstration.
Paper Preview
Abstract
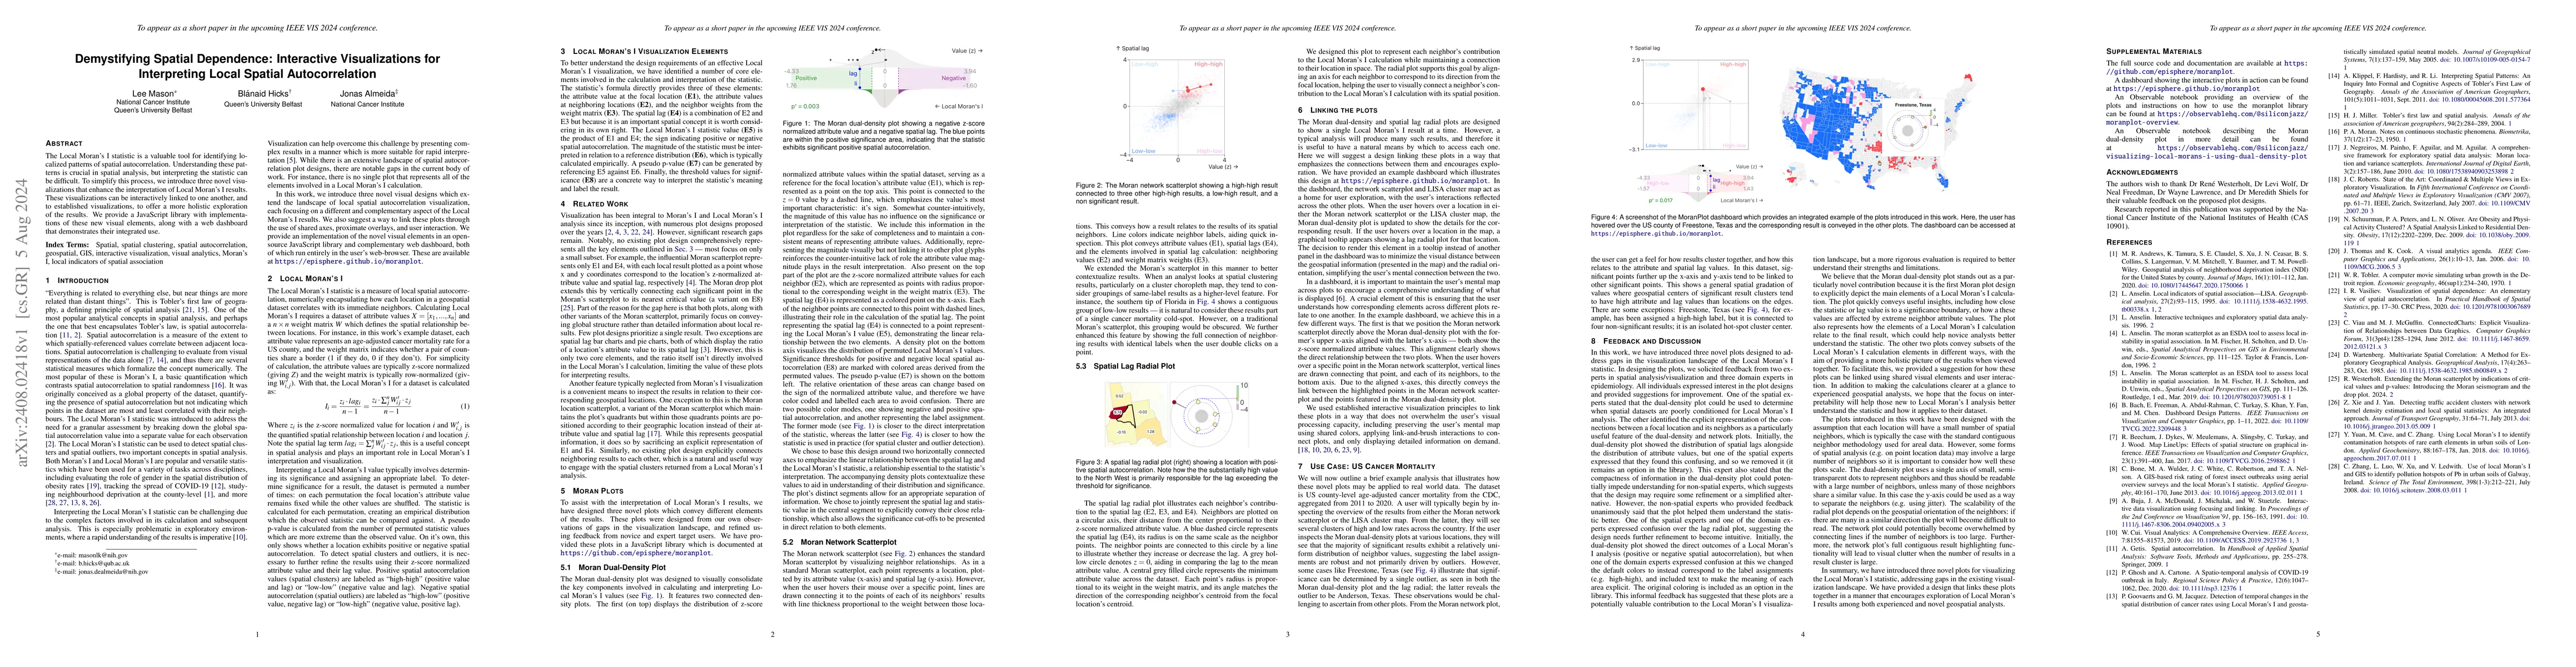
The Local Moran's I statistic is a valuable tool for identifying localized patterns of spatial autocorrelation. Understanding these patterns is crucial in spatial analysis, but interpreting the statistic can be difficult. To simplify this process, we introduce three novel visualizations that enhance the interpretation of Local Moran's I results. These visualizations can be interactively linked to one another, and to established visualizations, to offer a more holistic exploration of the results. We provide a JavaScript library with implementations of these new visual elements, along with a web dashboard that demonstrates their integrated use.
AI Key Findings
Get AI-generated insights about this paper's methodology, results, significance, and more — seven facets brought into focus.
Impact
Authors
PDF Preview
Citation Network
Current paper (gray), citations (green), references (blue)
Display is limited for performance on very large graphs.
Discussion 0