Authors
Summary
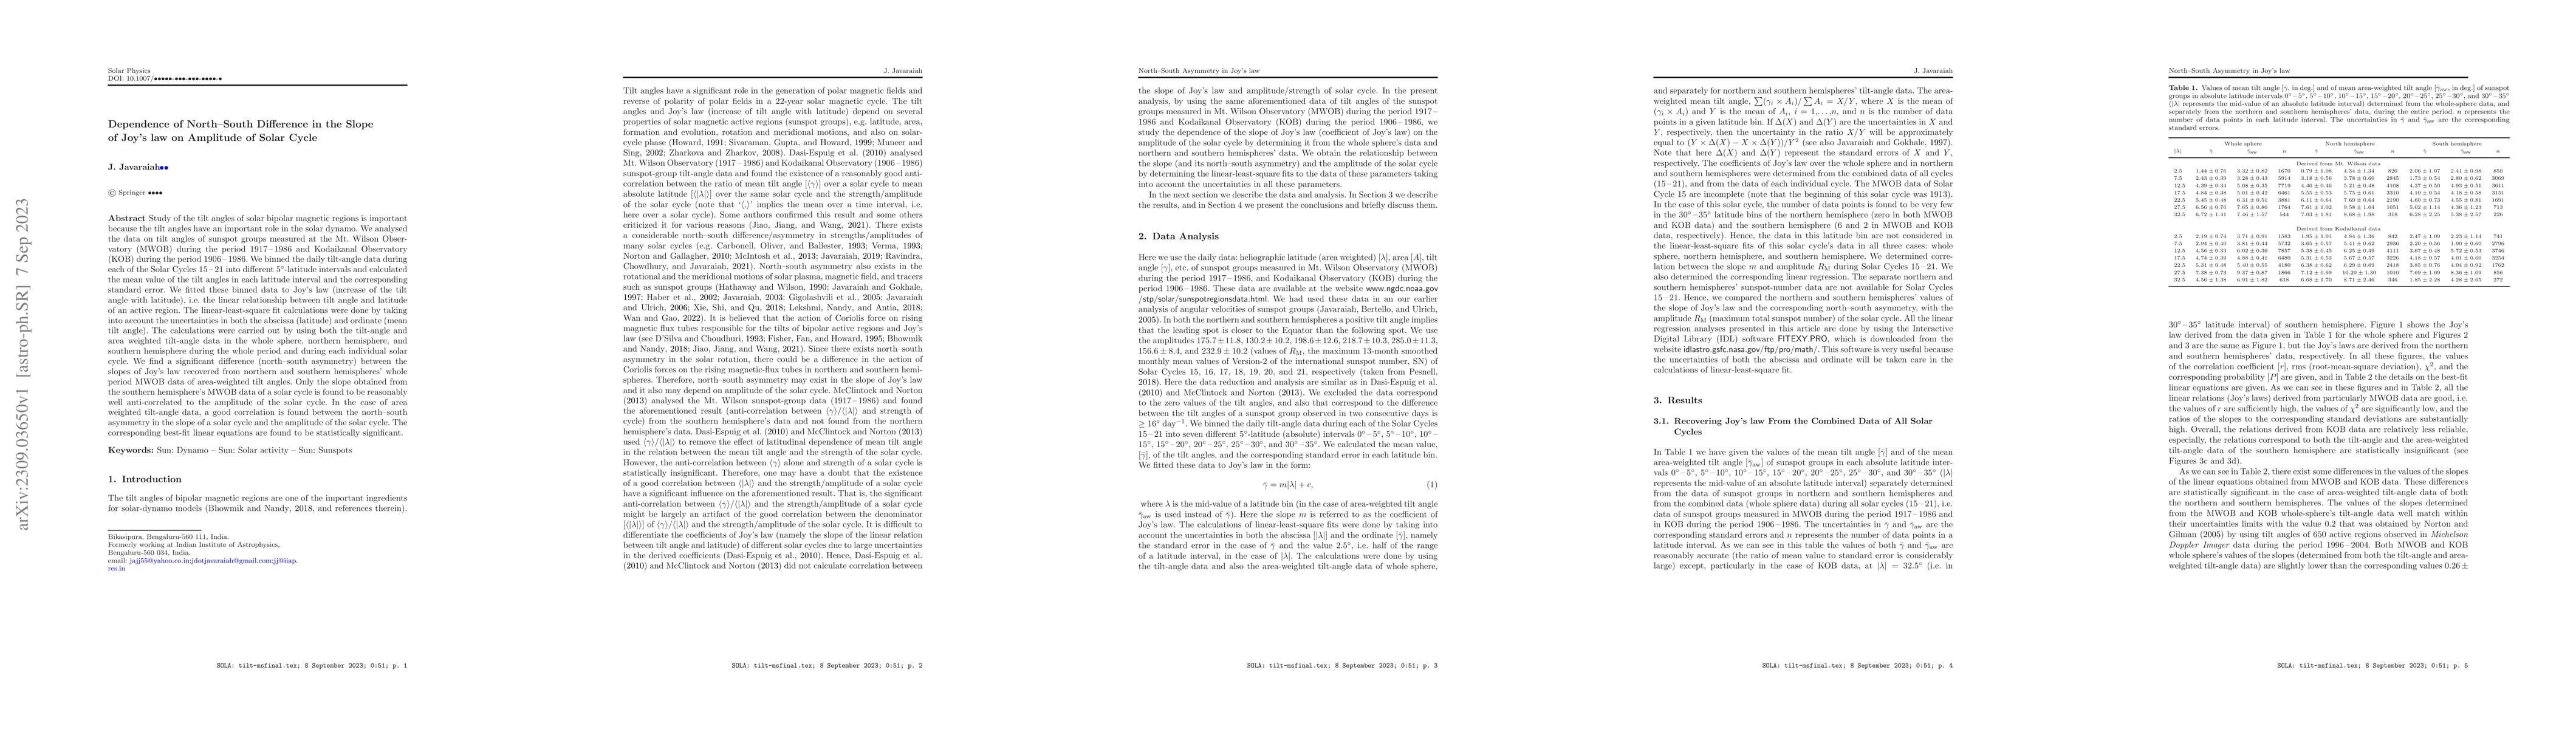
Study of the tilt angles of solar bipolar magnetic regions is important because the tilt angles have an important role in the solar dynamo. We analysed the data on tilt angles of sunspot groups measured at the Mt. Wilson Observatory (MWOB) during the period 1917-1986 and Kodaikanal Observatory (KOB) during the period 1906-1986. We binned the daily tilt-angle data during each of the Solar Cycles 15-21 into different 5-deg. latitude intervals and calculated the mean value of the tilt angles in each latitude interval and the corresponding standard error. We fitted these binned data to Joy's Law (increase of the tilt angle with latitude), i.e. the linear relationship between tilt angle and latitude of an active region. The linear-least-square fit calculations were done by taking into account the uncertainties in both the abscissa (latitude) and ordinate (mean tilt angle). The calculations were carried out by using both the tilt-angle and area weighted tilt-angle data in the whole sphere, northern hemisphere, and southern hemisphere during the whole period and during each individual solar cycle. We find a significant difference (absolute north--south asymmetry) between the slopes of Joy's Law recovered from northern and southern hemispheres' whole period MWOB data of area-weighted tilt angles. Only the slope obtained from the southern hemisphere's MWOB data of a solar cycle is found to be reasonably well anti-correlated to the amplitude of the solar cycle. In the case of area weighted tilt-angle data, a good correlation is found between the absolute north--south asymmetry in the slope of a solar cycle and the amplitude of the solar cycle. The corresponding best-fit linear equations are found to be statistically significant.
AI Key Findings
Get AI-generated insights about this paper's methodology, results, and significance.
Paper Details
PDF Preview
Key Terms
Citation Network
Current paper (gray), citations (green), references (blue)
Display is limited for performance on very large graphs.
Similar Papers
Found 4 papers| Title | Authors | Year | Actions |
|---|
Comments (0)