Description of stochastic and chaotic series using visibility graphs
Publication
Metrics
AI Quick Summary
This paper explores the use of visibility graphs to analyze stochastic and chaotic time series, demonstrating that the horizontal visibility algorithm can distinguish between correlated stochastic, uncorrelated, and chaotic processes through their exponential degree distribution. The study finds a precise threshold, λ = ln(3/2), to differentiate chaotic from correlated stochastic processes, supported by both analytical and numerical results.
Paper Preview
Abstract
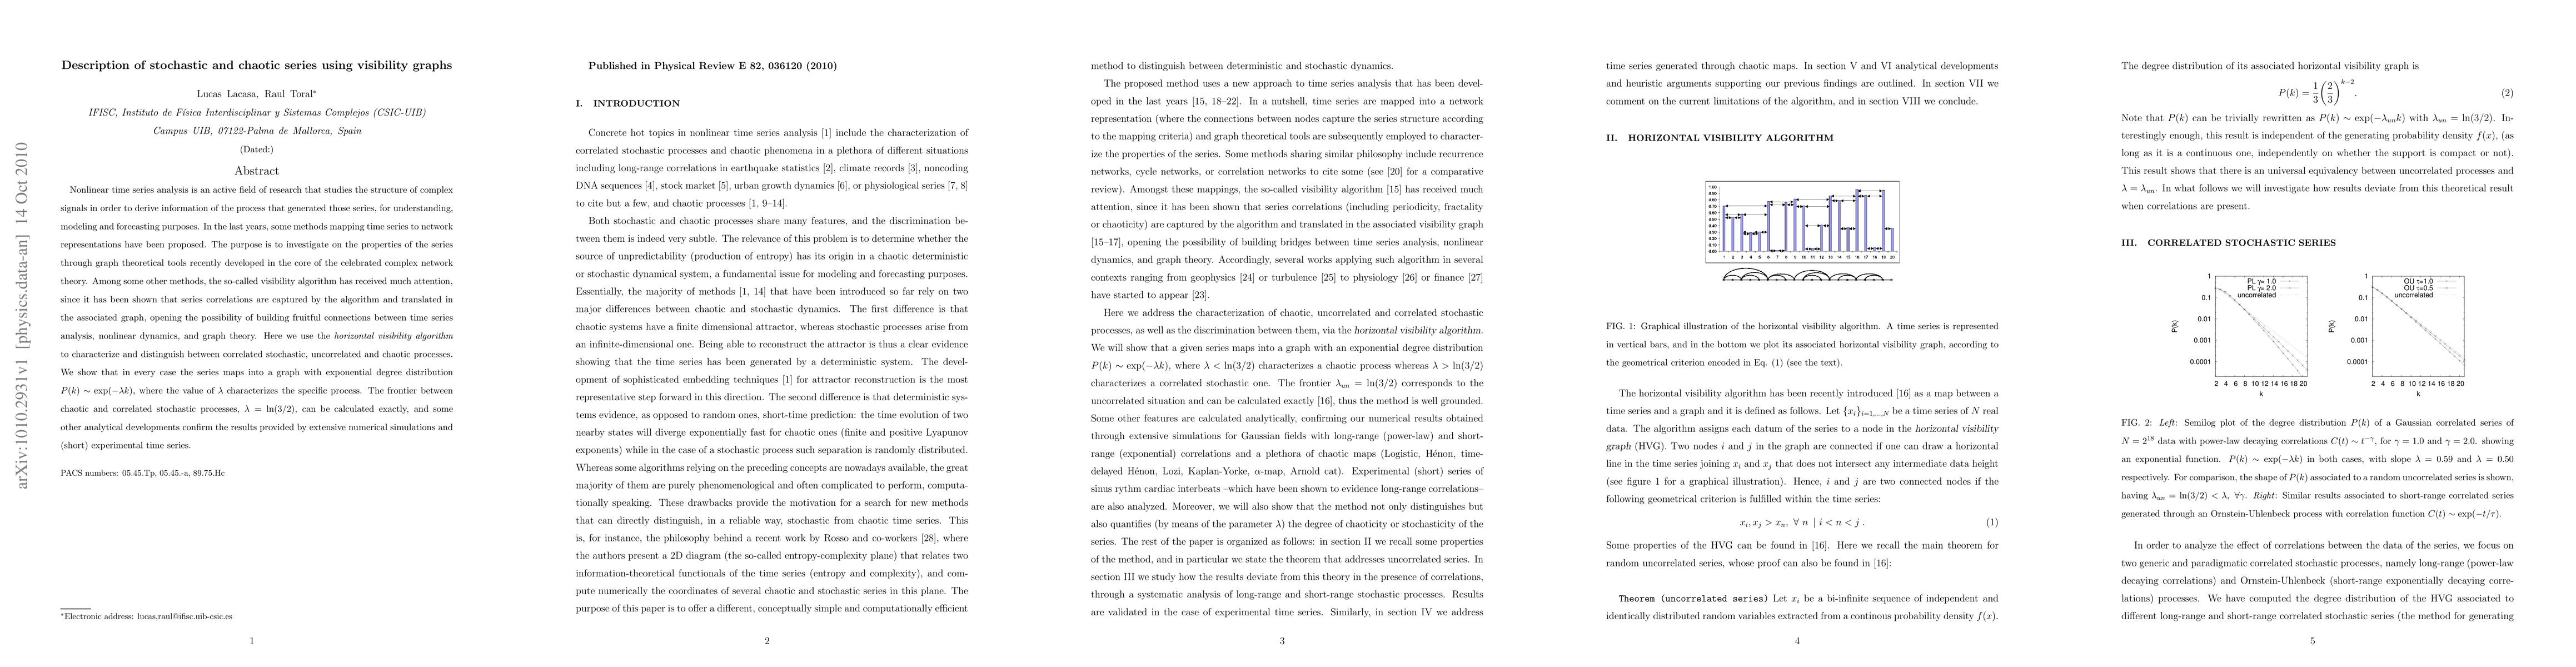
Nonlinear time series analysis is an active field of research that studies the structure of complex signals in order to derive information of the process that generated those series, for understanding, modeling and forecasting purposes. In the last years, some methods mapping time series to network representations have been proposed. The purpose is to investigate on the properties of the series through graph theoretical tools recently developed in the core of the celebrated complex network theory. Among some other methods, the so-called visibility algorithm has received much attention, since it has been shown that series correlations are captured by the algorithm and translated in the associated graph, opening the possibility of building fruitful connections between time series analysis, nonlinear dynamics, and graph theory. Here we use the horizontal visibility algorithm to characterize and distinguish between correlated stochastic, uncorrelated and chaotic processes. We show that in every case the series maps into a graph with exponential degree distribution P (k) ~ exp(-{\lambda}k), where the value of {\lambda} characterizes the specific process. The frontier between chaotic and correlated stochastic processes, {\lambda} = ln(3/2), can be calculated exactly, and some other analytical developments confirm the results provided by extensive numerical simulations and (short) experimental time series.
AI Key Findings
Get AI-generated insights about this paper's methodology, results, significance, and more — seven facets brought into focus.
Impact
Paper Details
PDF Preview
Key Terms
Citation Network
Current paper (gray), citations (green), references (blue)
Display is limited for performance on very large graphs.
Discussion 0