Design guidelines for narrative maps in sensemaking tasks
Publication
Metrics
AI Quick Summary
This paper presents design guidelines for narrative maps to aid analysts in sensemaking tasks, based on experiments with news articles. The study identifies how analysts construct these maps, evaluates specific features, and provides insights for designing effective visualization tools, emphasizing the importance of reducing redundant connections and incorporating multiple cognitive connections.
Paper Preview
Abstract
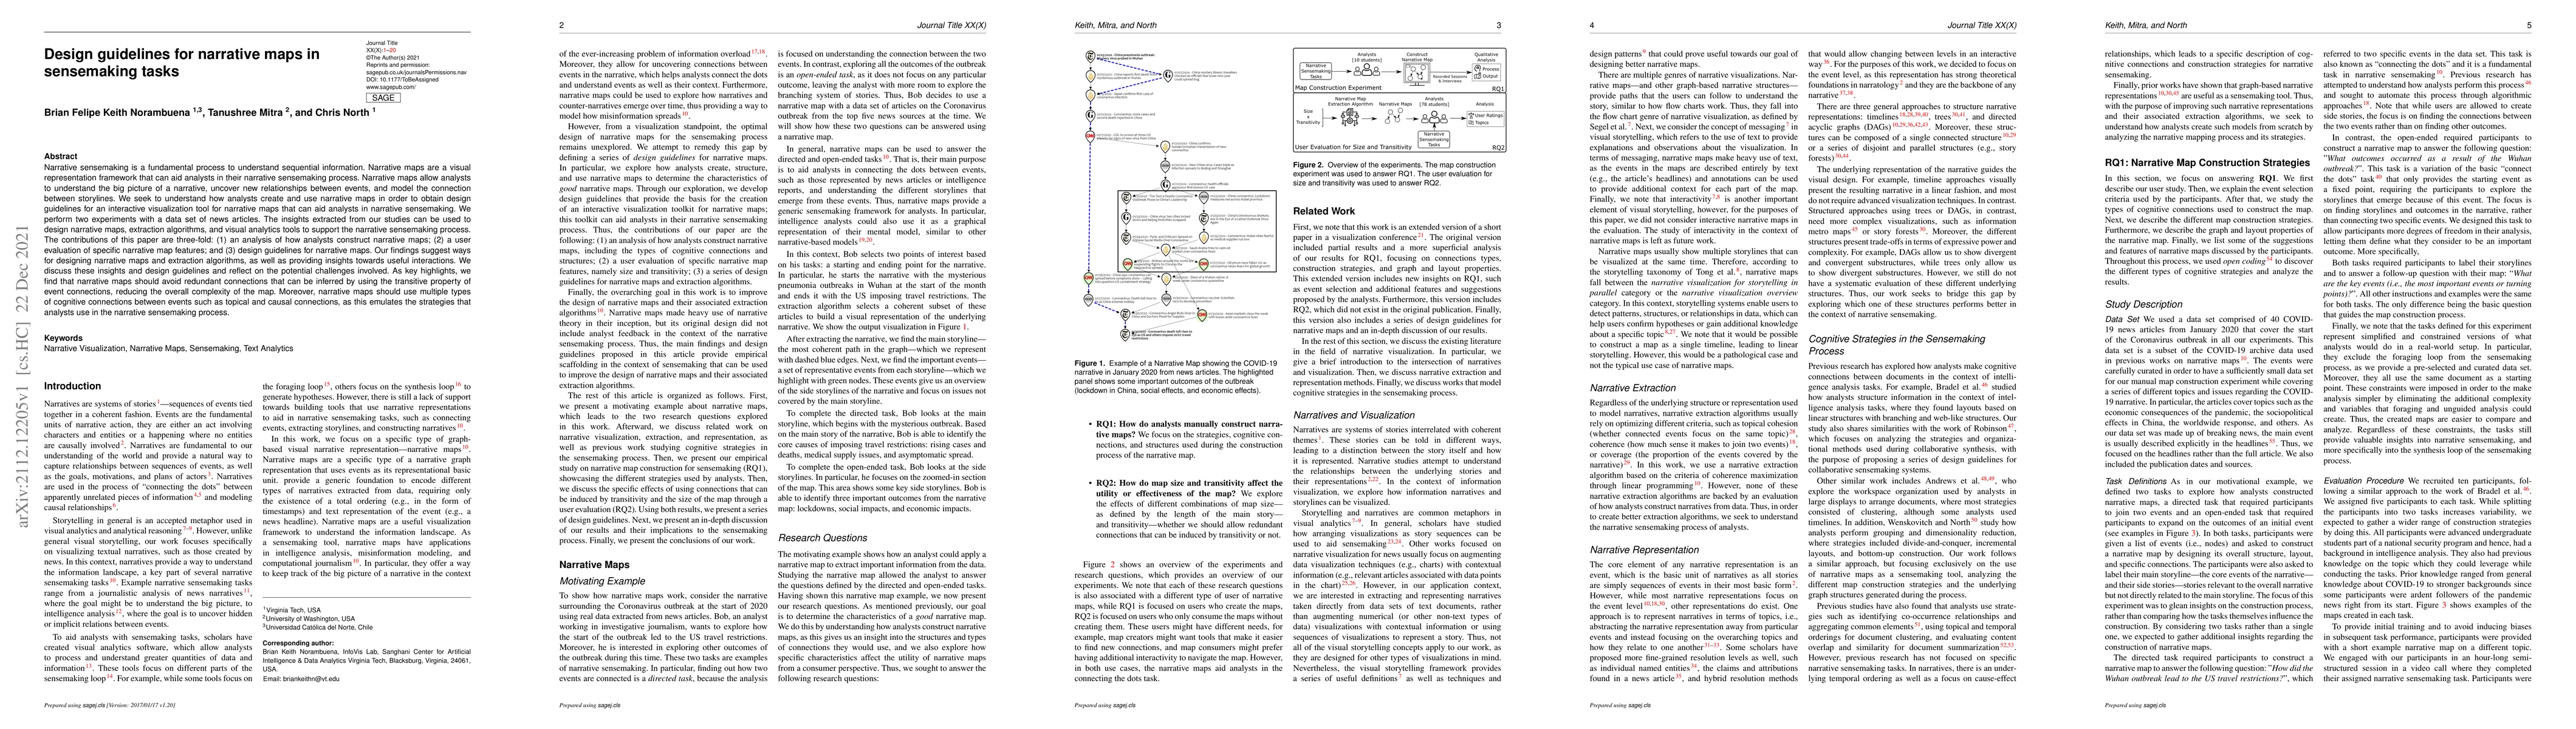
Narrative sensemaking is a fundamental process to understand sequential information. Narrative maps are a visual representation framework that can aid analysts in their narrative sensemaking process. Narrative maps allow analysts to understand the big picture of a narrative, uncover new relationships between events, and model the connection between storylines. We seek to understand how analysts create and use narrative maps in order to obtain design guidelines for an interactive visualization tool for narrative maps that can aid analysts in narrative sensemaking. We perform two experiments with a data set of news articles. The insights extracted from our studies can be used to design narrative maps, extraction algorithms, and visual analytics tools to support the narrative sensemaking process. The contributions of this paper are three-fold: (1) an analysis of how analysts construct narrative maps; (2) a user evaluation of specific narrative map features; and (3) design guidelines for narrative maps. Our findings suggest ways for designing narrative maps and extraction algorithms, as well as providing insights towards useful interactions. We discuss these insights and design guidelines and reflect on the potential challenges involved. As key highlights, we find that narrative maps should avoid redundant connections that can be inferred by using the transitive property of event connections, reducing the overall complexity of the map. Moreover, narrative maps should use multiple types of cognitive connections between events such as topical and causal connections, as this emulates the strategies that analysts use in the narrative sensemaking process.
AI Key Findings
Get AI-generated insights about this paper's methodology, results, significance, and more — seven facets brought into focus.
Impact
Paper Details
Authors
PDF Preview
Key Terms
Citation Network
Current paper (gray), citations (green), references (blue)
Display is limited for performance on very large graphs.
Discussion 0