Designing an Interactive, Notebook-Embedded, Tree Visualization to Support Exploratory Performance Analysis
Publication
Metrics
AI Quick Summary
This research designs an interactive, notebook-embedded tree visualization for exploratory performance analysis in parallel software, combining the strengths of direct manipulation and scripting. The study evaluates the effectiveness of this design with high performance computing experts, providing insights into the integration of interactive visualizations within computational notebooks.
Paper Preview
Abstract
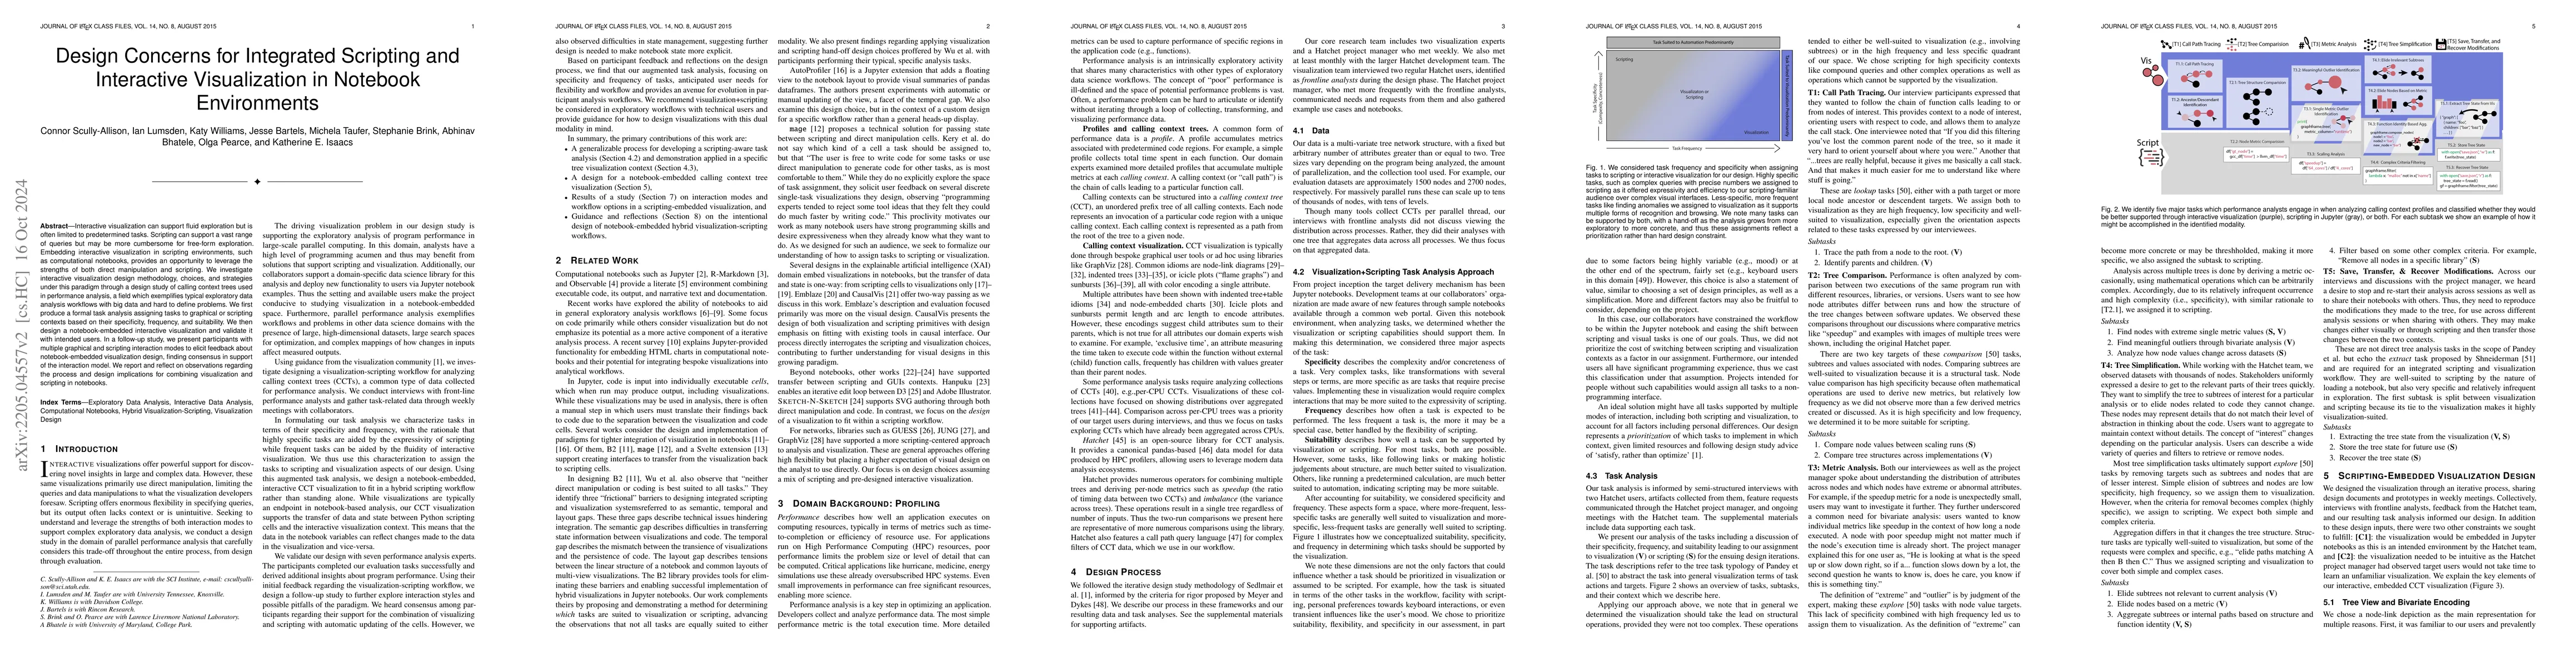
Interactive visualization via direct manipulation has inherent design trade-offs in flexibility, discoverability, and ease-of-use. Scripting languages can support a vast range of user queries and tasks, but may be more cumbersome for free-form exploration. Embedding interactive visualization in a scripting environment, such as a computational notebook, provides an opportunity for leveraging the strengths of both direct manipulation and scripting. We conduct a design study investigating this opportunity in the context of calling context trees as used for performance analysis of parallel software. Our collaborators make new performance analysis functionality available to users via Jupyter notebook examples, making the project setting conducive to such an investigation. Through a series of semi-structured interviews and regular meetings with project stakeholders, we produce a formal task analysis grounded in the expectation that tasks may be supported by scripting, interactive visualization, or both paradigms. We then design an interactive bivariate calling context tree visualization for embedding in Jupyter notebooks with features to pass data and state between the scripting and visualization contexts. We evaluated our embedded design with seven high performance computing experts. The experts were able to complete tasks and provided further feedback on the visualization and the notebook-embedded interactive visualization paradigm. We reflect upon the project and discuss factors in both the process and the design of the embedded visualization.
AI Key Findings
Get AI-generated insights about this paper's methodology, results, significance, and more — seven facets brought into focus.
Impact
Paper Details
PDF Preview
Key Terms
Citation Network
Current paper (gray), citations (green), references (blue)
Display is limited for performance on very large graphs.
Discussion 0