Destriping Cosmic Microwave Background Polarimeter data
Publication
Metrics
AI Quick Summary
This paper introduces a destriping algorithm designed specifically for polarimeter data from Cosmic Microwave Background surveys, implemented in parallel Python, and tested on simulated and real B-Machine data. The algorithm aims to remove low-frequency noise and is intended for future use on larger datasets from the LATTE experiment.
Paper Preview
Abstract
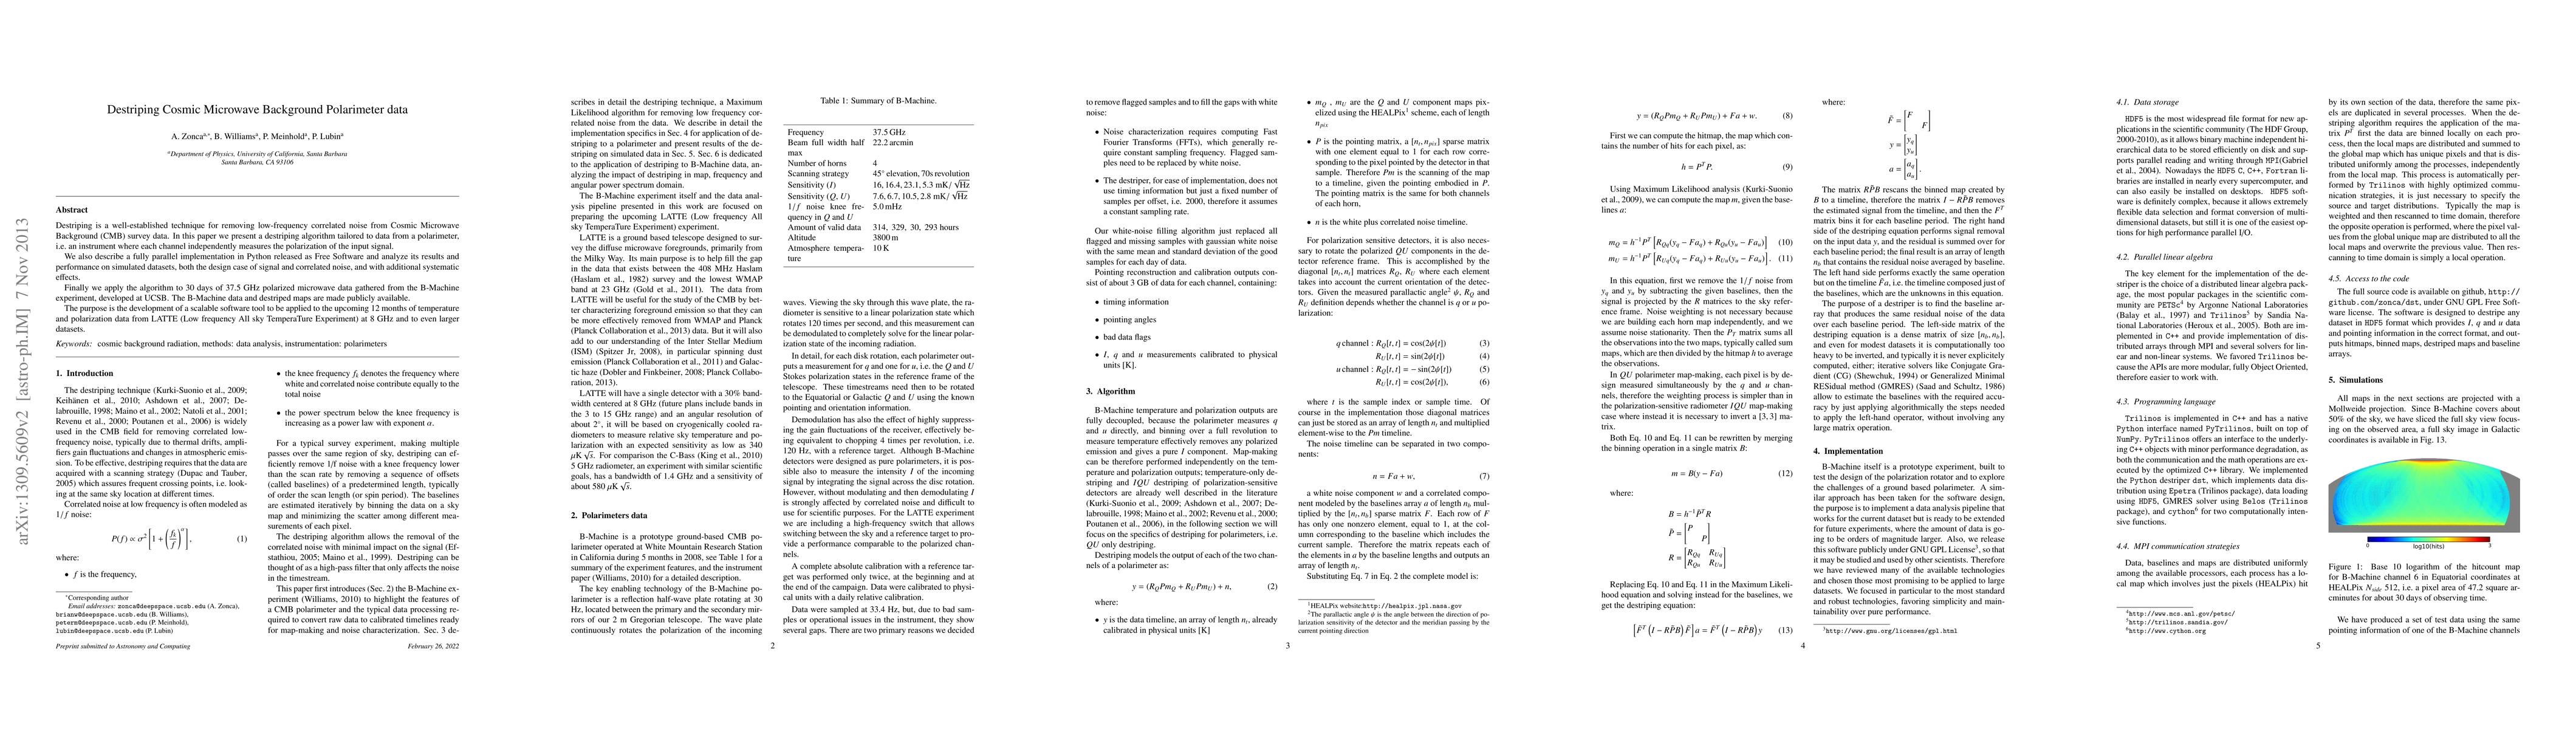
Destriping is a well-established technique for removing low-frequency correlated noise from Cosmic Microwave Background (CMB) survey data. In this paper we present a destriping algorithm tailored to data from a polarimeter, i.e. an instrument where each channel independently measures the polarization of the input signal. We also describe a fully parallel implementation in Python released as Free Software and analyze its results and performance on simulated datasets, both the design case of signal and correlated noise, and with additional systematic effects. Finally we apply the algorithm to 30 days of 37.5 GHz polarized microwave data gathered from the B-Machine experiment, developed at UCSB. The B-Machine data and destriped maps are made publicly available. The purpose is the development of a scalable software tool to be applied to the upcoming 12 months of temperature and polarization data from LATTE (Low frequency All sky TemperaTure Experiment) at 8 GHz and to even larger datasets.
AI Key Findings
Get AI-generated insights about this paper's methodology, results, significance, and more — seven facets brought into focus.
Impact
Paper Details
PDF Preview
Key Terms
Citation Network
Current paper (gray), citations (green), references (blue)
Display is limited for performance on very large graphs.
Discussion 0