Detecting and explaining changes in various assets' relationships in financial markets
Publication
Metrics
AI Quick Summary
This paper proposes a method to detect and visualize changes in relationships among various assets in financial markets using co-occurrence networks and Differential Network analysis. The approach provides human-interpretable network visualizations that help fund managers make informed decisions, as demonstrated by experiments showing alignment with actual market events.
Paper Preview
Abstract
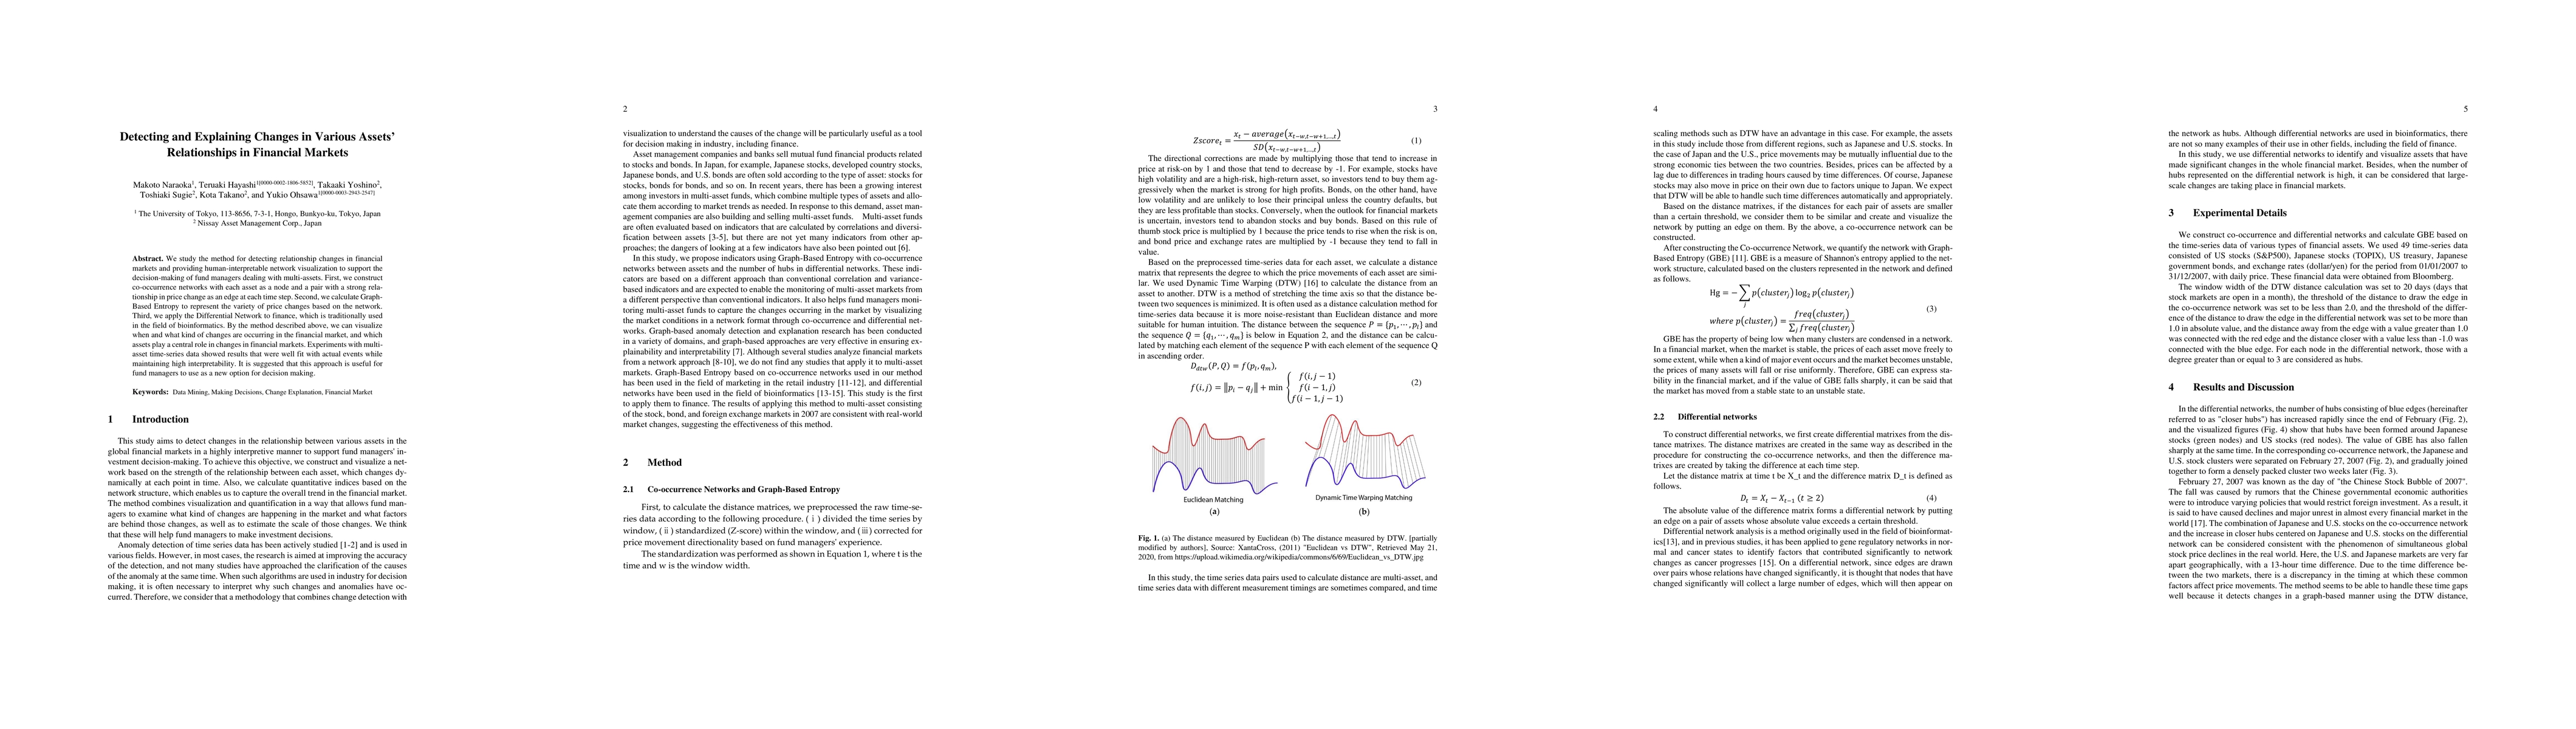
We study the method for detecting relationship changes in financial markets and providing human-interpretable network visualization to support the decision-making of fund managers dealing with multi-assets. First, we construct co-occurrence networks with each asset as a node and a pair with a strong relationship in price change as an edge at each time step. Second, we calculate Graph-Based Entropy to represent the variety of price changes based on the network. Third, we apply the Differential Network to finance, which is traditionally used in the field of bioinformatics. By the method described above, we can visualize when and what kind of changes are occurring in the financial market, and which assets play a central role in changes in financial markets. Experiments with multi-asset time-series data showed results that were well fit with actual events while maintaining high interpretability. It is suggested that this approach is useful for fund managers to use as a new option for decision making.
AI Key Findings
Get AI-generated insights about this paper's methodology, results, significance, and more — seven facets brought into focus.
Impact
Paper Details
PDF Preview
Key Terms
Citation Network
Current paper (gray), citations (green), references (blue)
Display is limited for performance on very large graphs.
Discussion 0