Detecting Anomalous Time Series by GAMLSS-Akaike-Weights-Scoring
Publication
Metrics
AI Quick Summary
This paper introduces a statistical framework using penalized likelihood distributional regression and generalized additive models for location, scale, and shape to detect anomalous time series. It employs Akaike weights to classify and rank anomalies, validated through simulations and real-world datasets, demonstrating high accuracy in identifying complex anomalies.
Paper Preview
Abstract
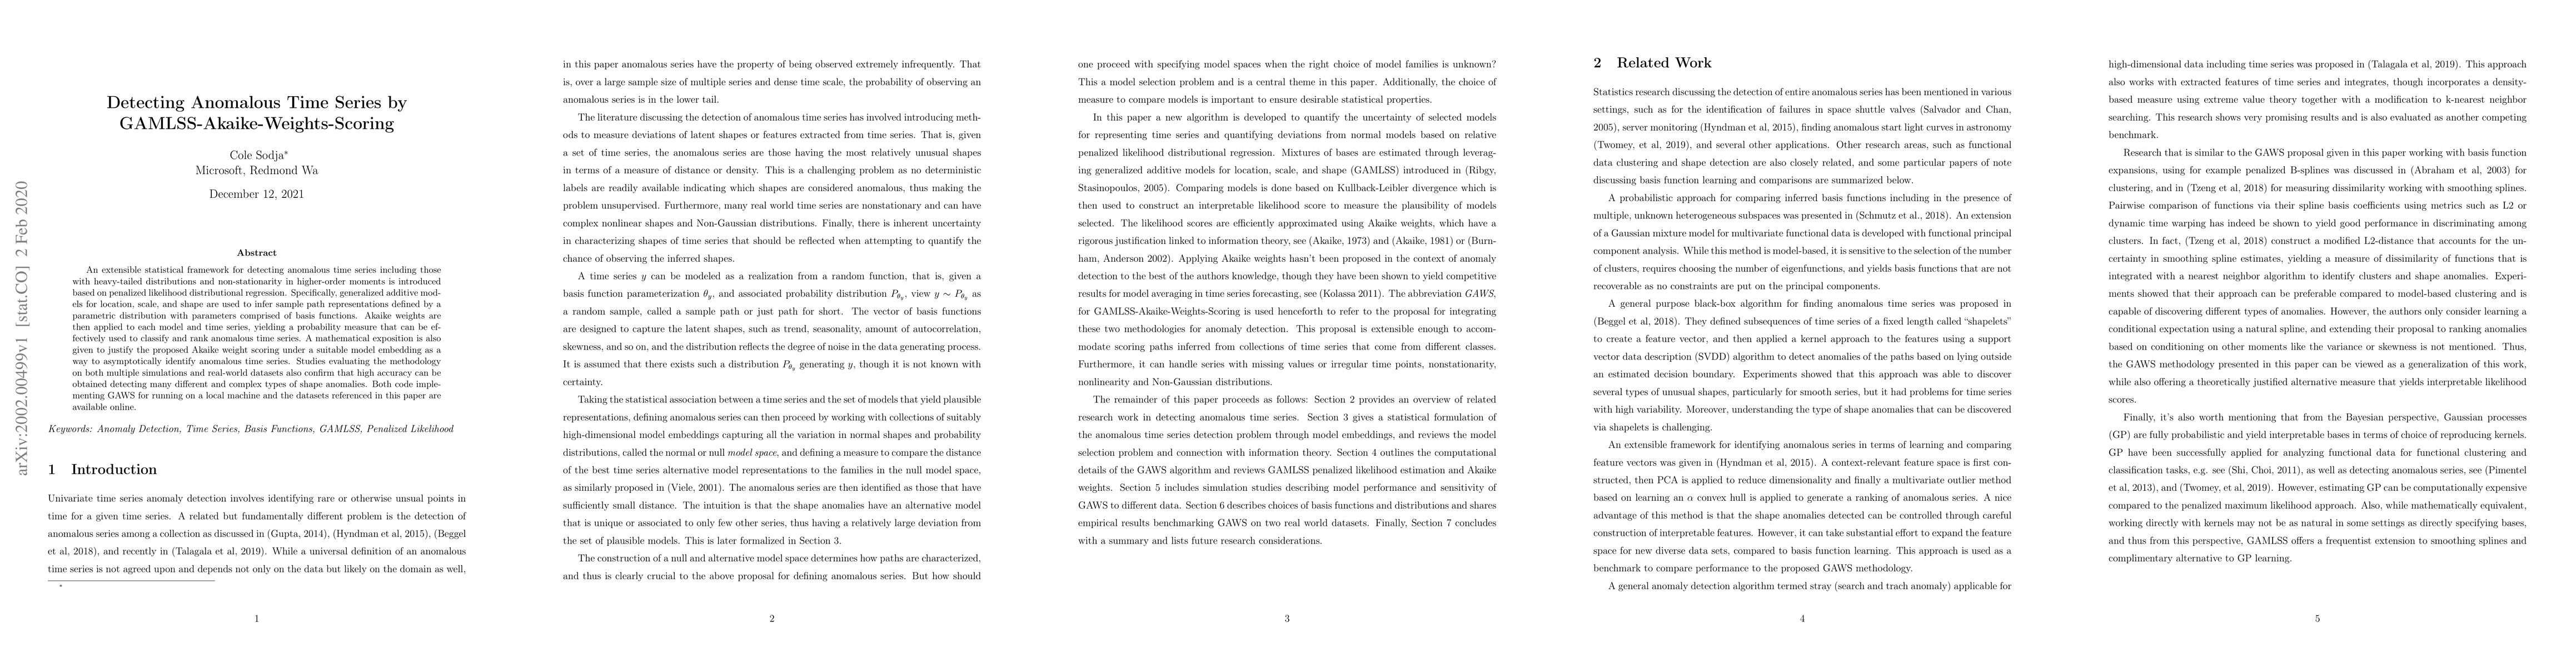
An extensible statistical framework for detecting anomalous time series including those with heavy-tailed distributions and non-stationarity in higher-order moments is introduced based on penalized likelihood distributional regression. Specifically, generalized additive models for location, scale, and shape are used to infer sample path representations defined by a parametric distribution with parameters comprised of basis functions. Akaike weights are then applied to each model and time series, yielding a probability measure that can be effectively used to classify and rank anomalous time series. A mathematical exposition is also given to justify the proposed Akaike weight scoring under a suitable model embedding as a way to asymptotically identify anomalous time series. Studies evaluating the methodology on both multiple simulations and real-world datasets also confirm that high accuracy can be obtained detecting many different and complex types of shape anomalies. Both code implementing GAWS for running on a local machine and the datasets referenced in this paper are available online.
AI Key Findings
Get AI-generated insights about this paper's methodology, results, significance, and more — seven facets brought into focus.
Impact
Paper Details
Authors
PDF Preview
Key Terms
Citation Network
Current paper (gray), citations (green), references (blue)
Display is limited for performance on very large graphs.
Discussion 0