Detecting change-points in noisy GPS time series with continuous piecewise structures
Publication
Metrics
AI Quick Summary
This paper proposes a new method using Singular Spectrum Analysis to detect change-points in noisy GPS time series data with continuous piecewise structures, specifically for identifying slow slip events. The Isolate-Detect algorithm is applied to reveal change-points in data with piecewise-non-linear structures, validated through both simulated and real data.
Paper Preview
Abstract
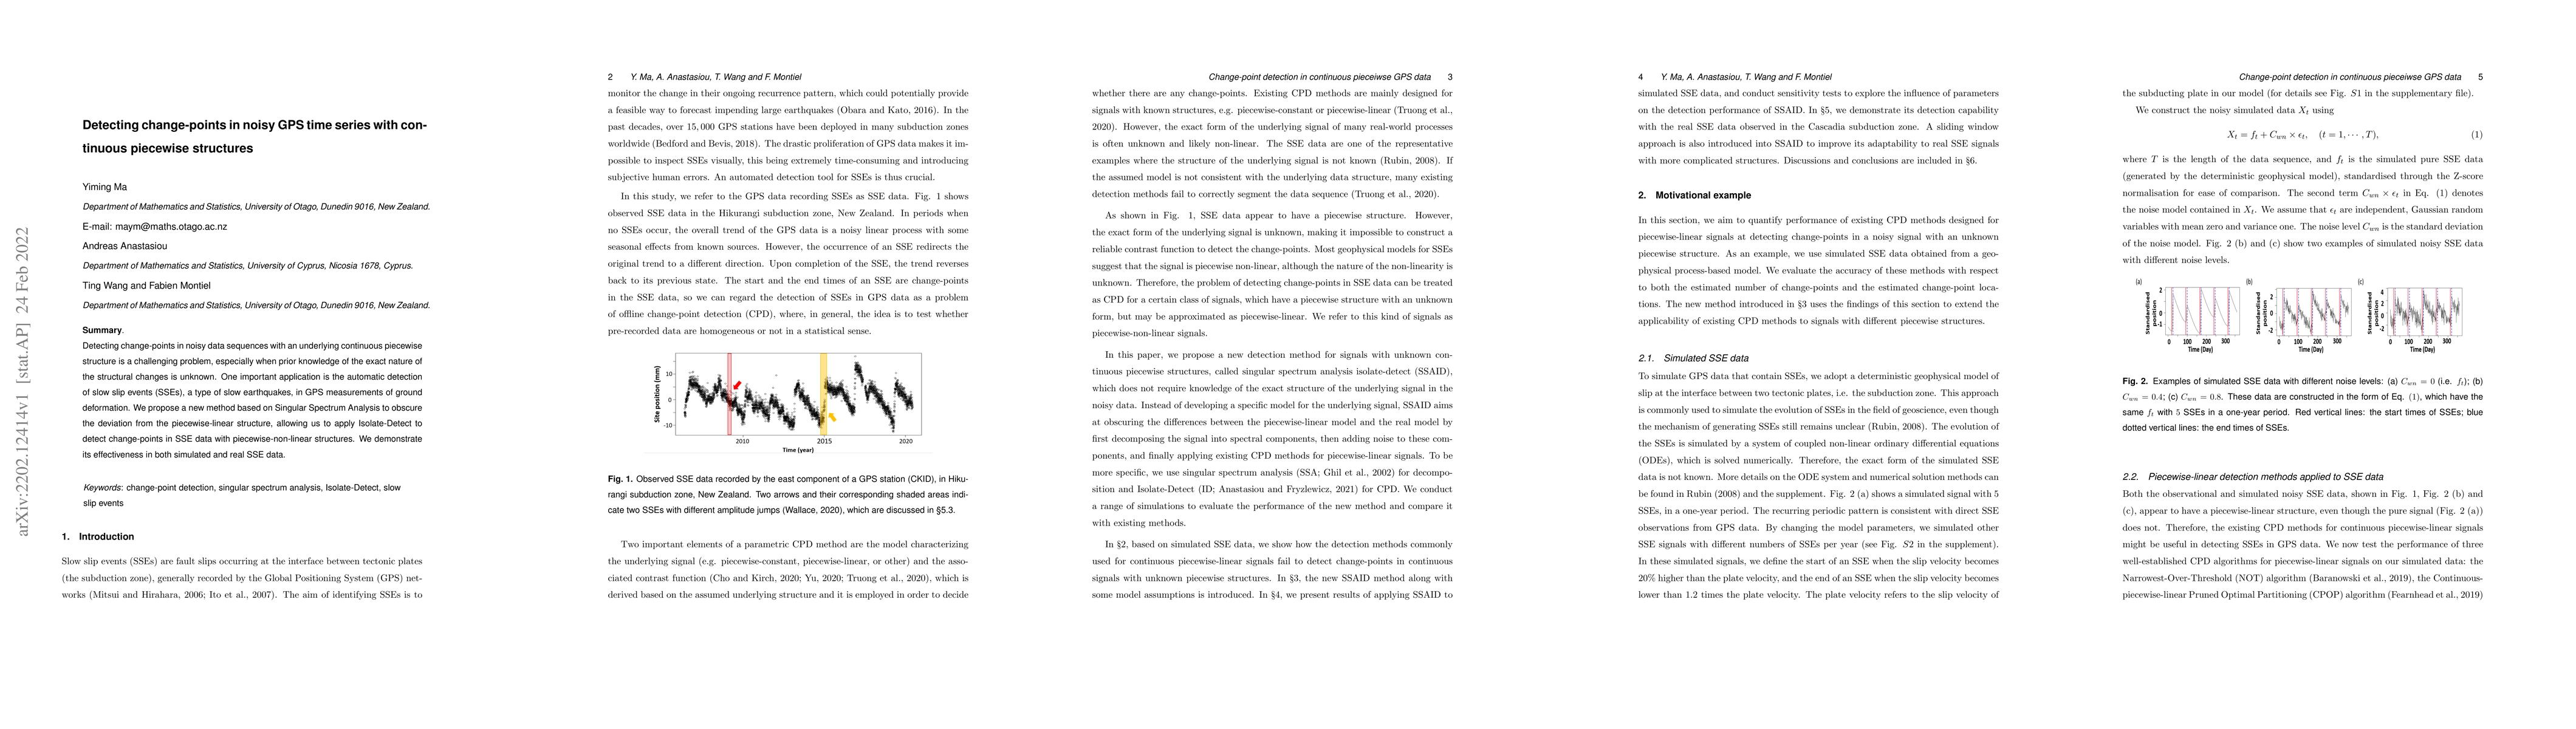
Detecting change-points in noisy data sequences with an underlying continuous piecewise structure is a challenging problem, especially when prior knowledge of the exact nature of the structural changes is unknown. One important application is the automatic detection of slow slip events (SSEs), a type of slow earthquakes, in GPS measurements of ground deformation. We propose a new method based on Singular Spectrum Analysis to obscure the deviation from the piecewise-linear structure, allowing us to apply Isolate-Detect to detect change-points in SSE data with piecewise-non-linear structures. We demonstrate its effectiveness in both simulated and real SSE data.
AI Key Findings — Failed
Key findings generation failed. Failed to start generation process
Impact
Paper Details
Authors
PDF Preview
Key Terms
Citation Network
Current paper (gray), citations (green), references (blue)
Display is limited for performance on very large graphs.
Discussion 0