Detecting Global Community Structure in a COVID-19 Activity Correlation Network
Publication
Metrics
AI Quick Summary
This paper constructs a correlation network from the Johns Hopkins COVID-19 dataset to study global community structures during the pandemic. Using a correlation network based on daily change exponents and modularity maximization, it identifies three major communities with distinct pandemic patterns, highlighting the impact of variants on different regions.
Paper Preview
Abstract
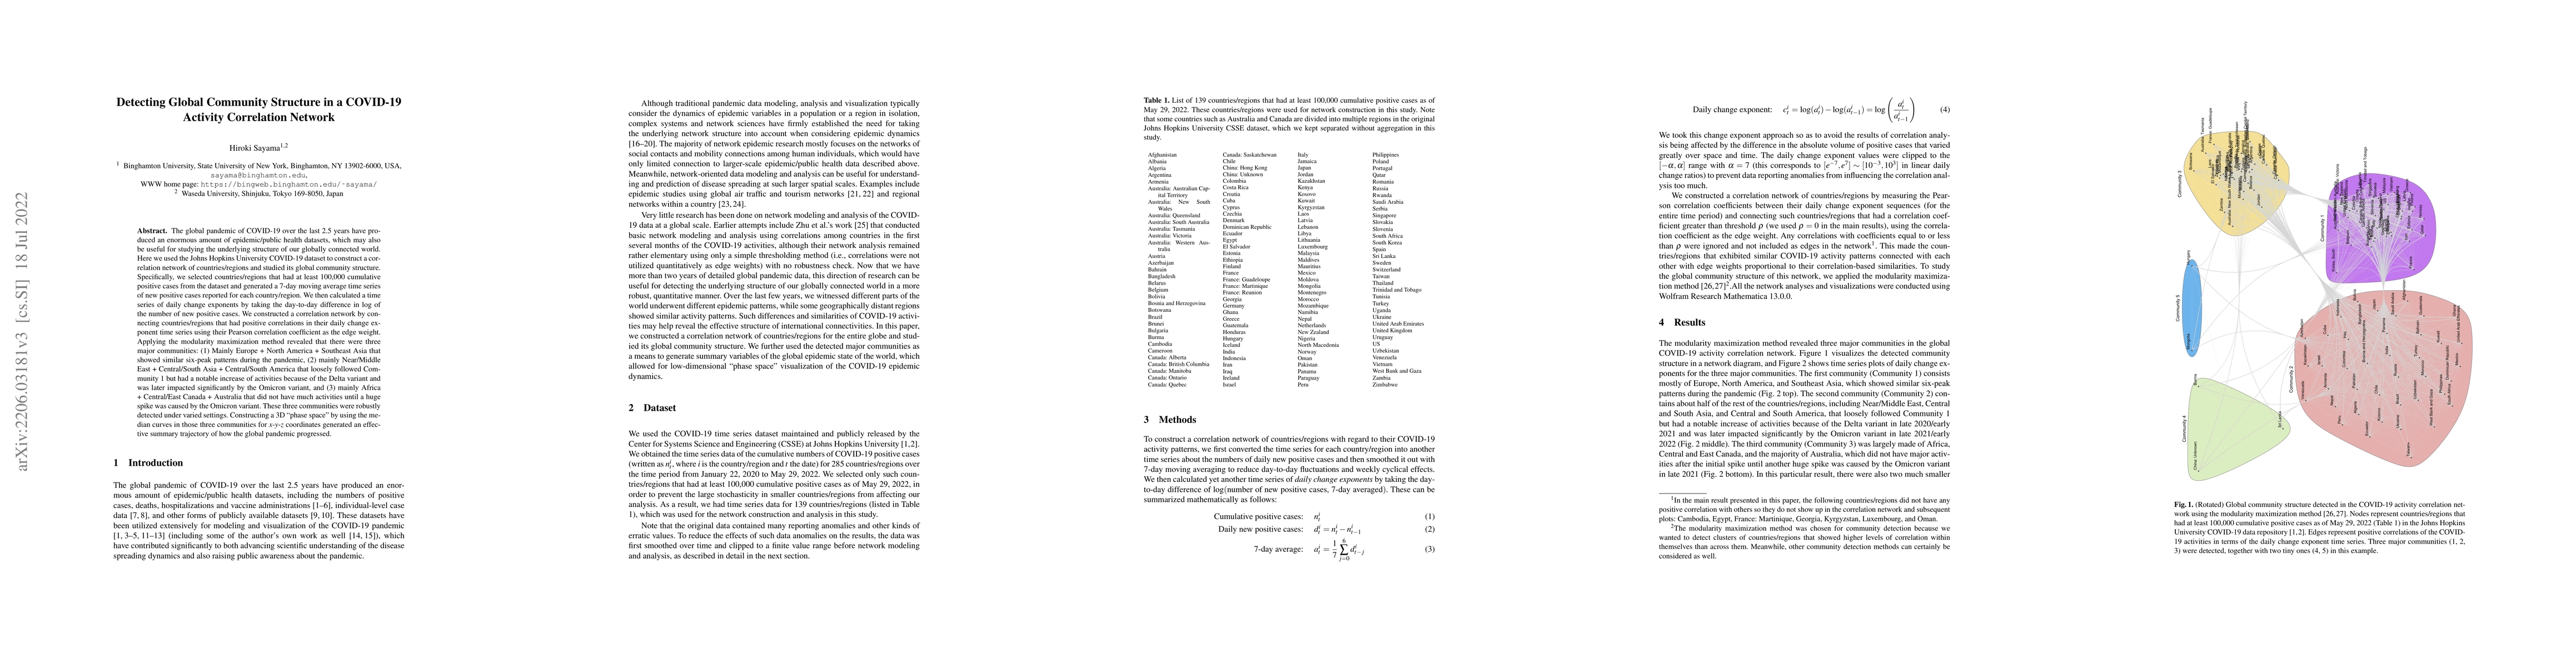
The global pandemic of COVID-19 over the last 2.5 years have produced an enormous amount of epidemic/public health datasets, which may also be useful for studying the underlying structure of our globally connected world. Here we used the Johns Hopkins University COVID-19 dataset to construct a correlation network of countries/regions and studied its global community structure. Specifically, we selected countries/regions that had at least 100,000 cumulative positive cases from the dataset and generated a 7-day moving average time series of new positive cases reported for each country/region. We then calculated a time series of daily change exponents by taking the day-to-day difference in log of the number of new positive cases. We constructed a correlation network by connecting countries/regions that had positive correlations in their daily change exponent time series using their Pearson correlation coefficient as the edge weight. Applying the modularity maximization method revealed that there were three major communities: (1) Mainly Europe + North America + Southeast Asia that showed similar six-peak patterns during the pandemic, (2) mainly Near/Middle East + Central/South Asia + Central/South America that loosely followed Community 1 but had a notable increase of activities because of the Delta variant and was later impacted significantly by the Omicron variant, and (3) mainly Africa + Central/East Canada + Australia that did not have much activities until a huge spike was caused by the Omicron variant. These three communities were robustly detected under varied settings. Constructing a 3D "phase space" by using the median curves in those three communities for x-y-z coordinates generated an effective summary trajectory of how the global pandemic progressed.
AI Key Findings
Get AI-generated insights about this paper's methodology, results, significance, and more — seven facets brought into focus.
Impact
Paper Details
Authors
PDF Preview
Key Terms
Citation Network
Current paper (gray), citations (green), references (blue)
Display is limited for performance on very large graphs.
Discussion 0