Detecting structural breaks in seasonal time series by regularized optimization
Publication
Metrics
AI Quick Summary
This paper proposes a regularized optimization method to detect structural breaks in seasonal time series, addressing the challenge of identifying abrupt changes in dynamic systems. The method introduces a penalty function to manage the ill-posed problem of parameter selection, enabling the simultaneous identification of seasonality and trend without iterative processes.
Paper Preview
Abstract
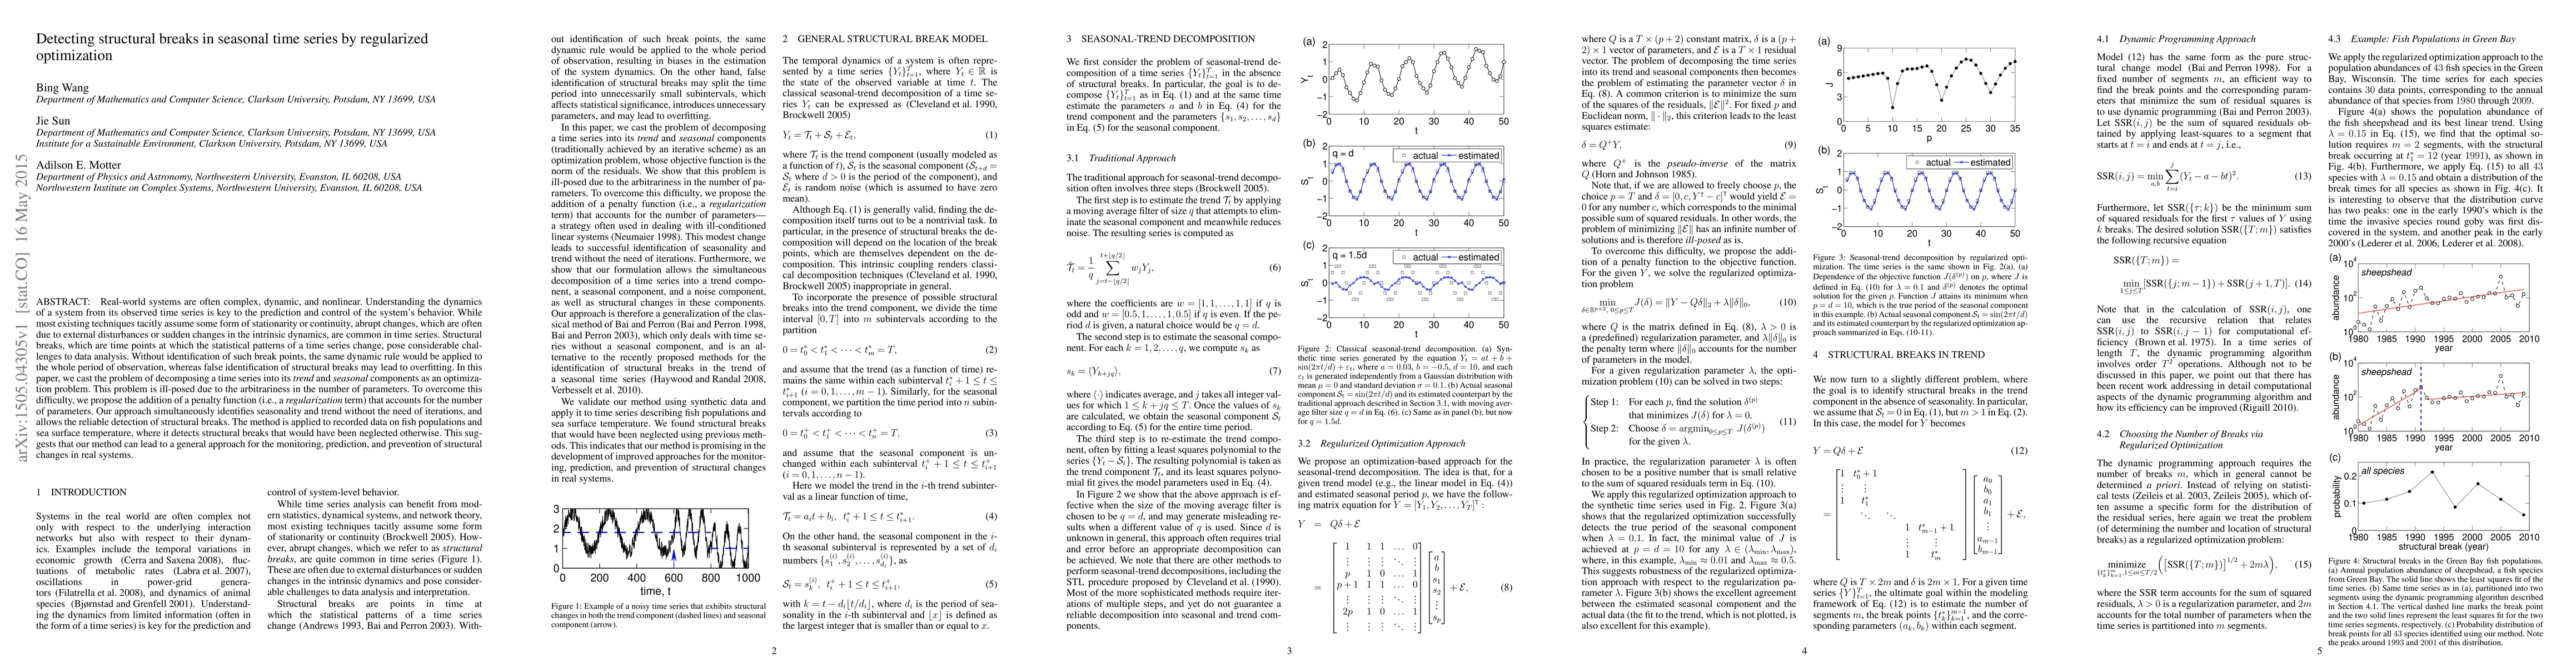
Real-world systems are often complex, dynamic, and nonlinear. Understanding the dynamics of a system from its observed time series is key to the prediction and control of the system's behavior. While most existing techniques tacitly assume some form of stationarity or continuity, abrupt changes, which are often due to external disturbances or sudden changes in the intrinsic dynamics, are common in time series. Structural breaks, which are time points at which the statistical patterns of a time series change, pose considerable challenges to data analysis. Without identification of such break points, the same dynamic rule would be applied to the whole period of observation, whereas false identification of structural breaks may lead to overfitting. In this paper, we cast the problem of decomposing a time series into its trend and seasonal components as an optimization problem. This problem is ill-posed due to the arbitrariness in the number of parameters. To overcome this difficulty, we propose the addition of a penalty function (i.e., a regularization term) that accounts for the number of parameters. Our approach simultaneously identifies seasonality and trend without the need of iterations, and allows the reliable detection of structural breaks. The method is applied to recorded data on fish populations and sea surface temperature, where it detects structural breaks that would have been neglected otherwise. This suggests that our method can lead to a general approach for the monitoring, prediction, and prevention of structural changes in real systems.
AI Key Findings
Get AI-generated insights about this paper's methodology, results, significance, and more — seven facets brought into focus.
Impact
Paper Details
PDF Preview
Key Terms
Citation Network
Current paper (gray), citations (green), references (blue)
Display is limited for performance on very large graphs.
Discussion 0