Detecting Weak Distribution Shifts via Displacement Interpolation
Publication
Metrics
AI Quick Summary
This research proposes a method for detecting weak distribution shifts using displacement interpolation based on optimal transport theory. It introduces a hypothesis testing procedure with sharp detection conditions and analyzes Type I and Type II errors, demonstrated through examples involving shifts in consumer spending post-COVID-19 and heterogeneity in statistical test p-values across disciplines.
Paper Preview
Abstract
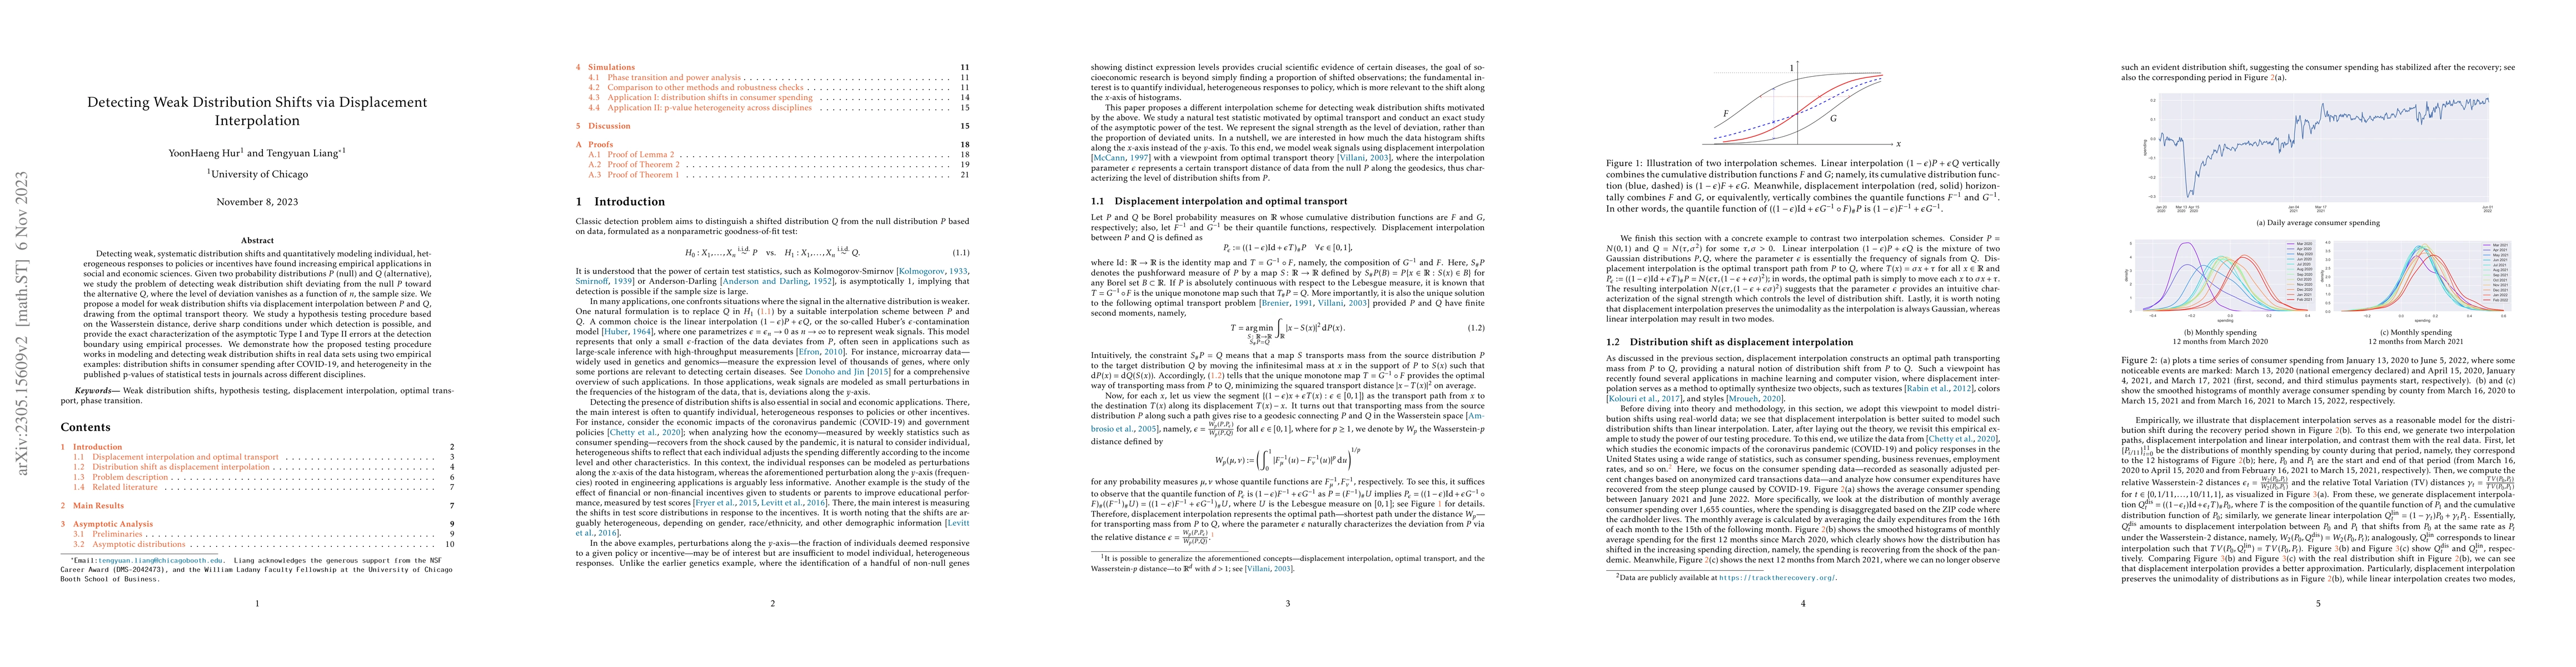
Detecting weak, systematic distribution shifts and quantitatively modeling individual, heterogeneous responses to policies or incentives have found increasing empirical applications in social and economic sciences. Given two probability distributions $P$ (null) and $Q$ (alternative), we study the problem of detecting weak distribution shift deviating from the null $P$ toward the alternative $Q$, where the level of deviation vanishes as a function of $n$, the sample size. We propose a model for weak distribution shifts via displacement interpolation between $P$ and $Q$, drawing from the optimal transport theory. We study a hypothesis testing procedure based on the Wasserstein distance, derive sharp conditions under which detection is possible, and provide the exact characterization of the asymptotic Type I and Type II errors at the detection boundary using empirical processes. We demonstrate how the proposed testing procedure works in modeling and detecting weak distribution shifts in real data sets using two empirical examples: distribution shifts in consumer spending after COVID-19, and heterogeneity in the published p-values of statistical tests in journals across different disciplines.
AI Key Findings
Get AI-generated insights about this paper's methodology, results, significance, and more — seven facets brought into focus.
Impact
Paper Details
Authors
PDF Preview
Key Terms
Citation Network
Current paper (gray), citations (green), references (blue)
Display is limited for performance on very large graphs.
Discussion 0