Development and Implementation of a Dashboard for Diabetes Care Management in OpenMRS
Publication
Metrics
AI Quick Summary
This paper details the development of a diabetes-specific dashboard within the OpenMRS system to consolidate and visualize diabetes-related lab measures for physicians, aiming to improve decision-making. The dashboard features gauge charts, data tables, and interactive line charts, and was demonstrated as a proof of concept with limited patient data.
Paper Preview
Abstract
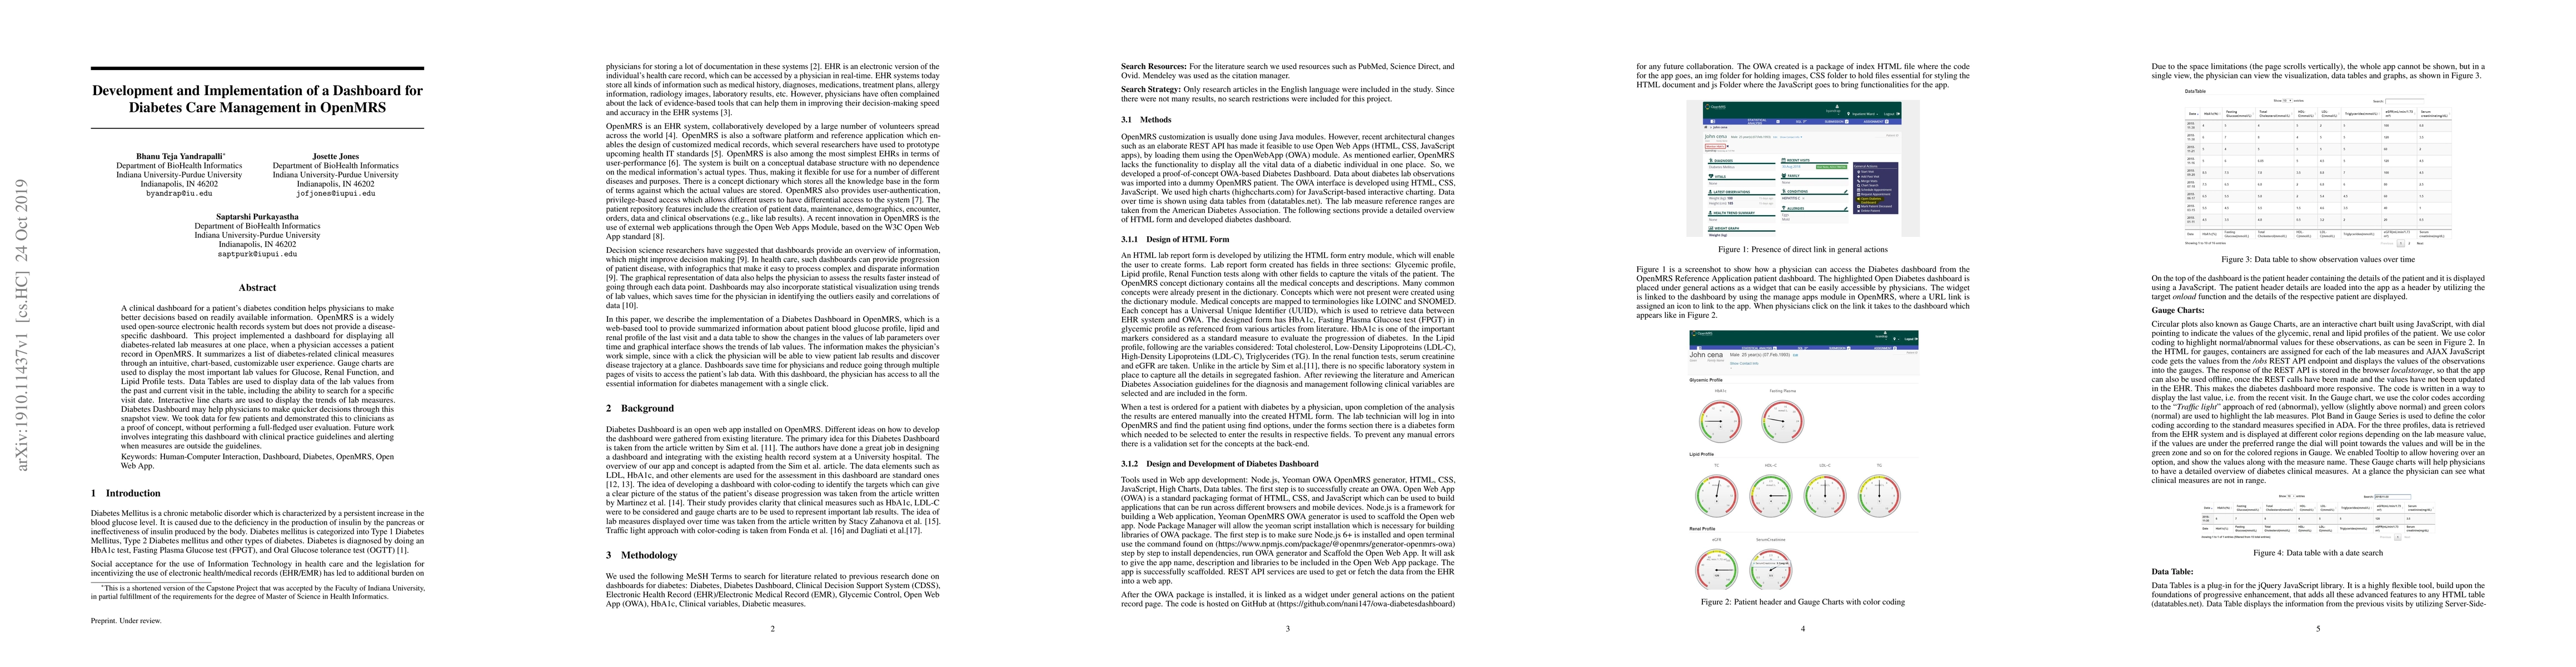
A clinical dashboard for a patient's diabetes condition helps physicians to make better decisions based on readily available information. OpenMRS is a widely used open-source electronic health records system but does not provide a disease-specific dashboard. This project implemented a dashboard for displaying all diabetes-related lab measures at one place, when a physician accesses a patient record in OpenMRS. It summarizes a list of diabetes-related clinical measures through an intuitive, chart-based, customizable user experience. Gauge charts are used to display the most important lab values for Glucose, Renal Function, and Lipid Profile tests. Data Tables are used to display data of the lab values from the past and current visit in the table, including the ability to search for a specific visit date. Interactive line charts are used to display the trends of lab measures. Diabetes Dashboard may help physicians to make quicker decisions through this snapshot view. We took data for a few patients and demonstrated this to clinicians as a proof of concept, without performing a full-fledged user evaluation. Future work involves integrating this dashboard with clinical practice guidelines and alerting when measures are outside the guidelines.
AI Key Findings
Get AI-generated insights about this paper's methodology, results, significance, and more — seven facets brought into focus.
Impact
Paper Details
Authors
PDF Preview
Key Terms
Citation Network
Current paper (gray), citations (green), references (blue)
Display is limited for performance on very large graphs.
Discussion 0