dg2pix: Pixel-Based Visual Analysis of Dynamic Graphs
Publication
Metrics
AI Quick Summary
dg2pix is a novel pixel-based visualization technique for exploring large-scale dynamic graphs by modeling temporal dimensions, embedding graph data, and providing interactive visualizations. It enables scalable overviews and identification of temporal patterns in long sequences of high-dimensional graph data.
Paper Preview
Abstract
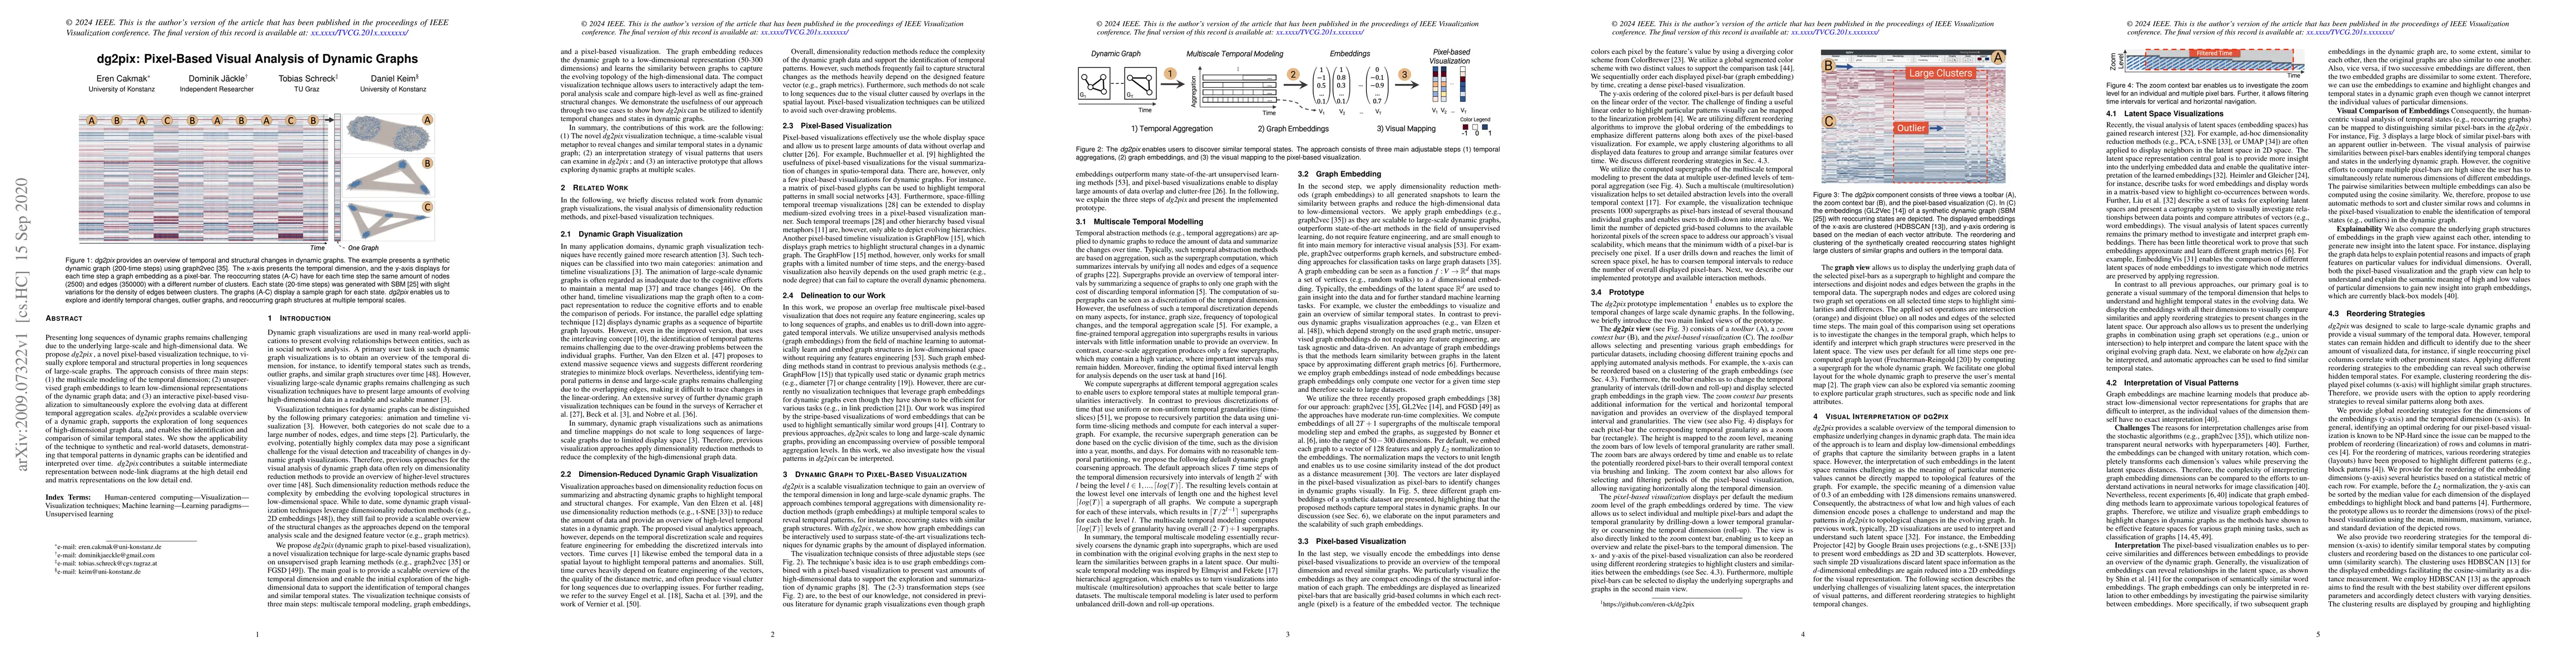
Presenting long sequences of dynamic graphs remains challenging due to the underlying large-scale and high-dimensional data. We propose dg2pix, a novel pixel-based visualization technique, to visually explore temporal and structural properties in long sequences of large-scale graphs. The approach consists of three main steps: (1) the multiscale modeling of the temporal dimension; (2) unsupervised graph embeddings to learn low-dimensional representations of the dynamic graph data; and (3) an interactive pixel-based visualization to simultaneously explore the evolving data at different temporal aggregation scales. dg2pix provides a scalable overview of a dynamic graph, supports the exploration of long sequences of high-dimensional graph data, and enables the identification and comparison of similar temporal states. We show the applicability of the technique to synthetic and real-world datasets, demonstrating that temporal patterns in dynamic graphs can be identified and interpreted over time. dg2pix contributes a suitable intermediate representation between node-link diagrams at the high detail end and matrix representations on the low detail end.
AI Key Findings
Get AI-generated insights about this paper's methodology, results, significance, and more — seven facets brought into focus.
Impact
Paper Details
Authors
PDF Preview
Key Terms
Citation Network
Current paper (gray), citations (green), references (blue)
Display is limited for performance on very large graphs.
Discussion 0