Summary
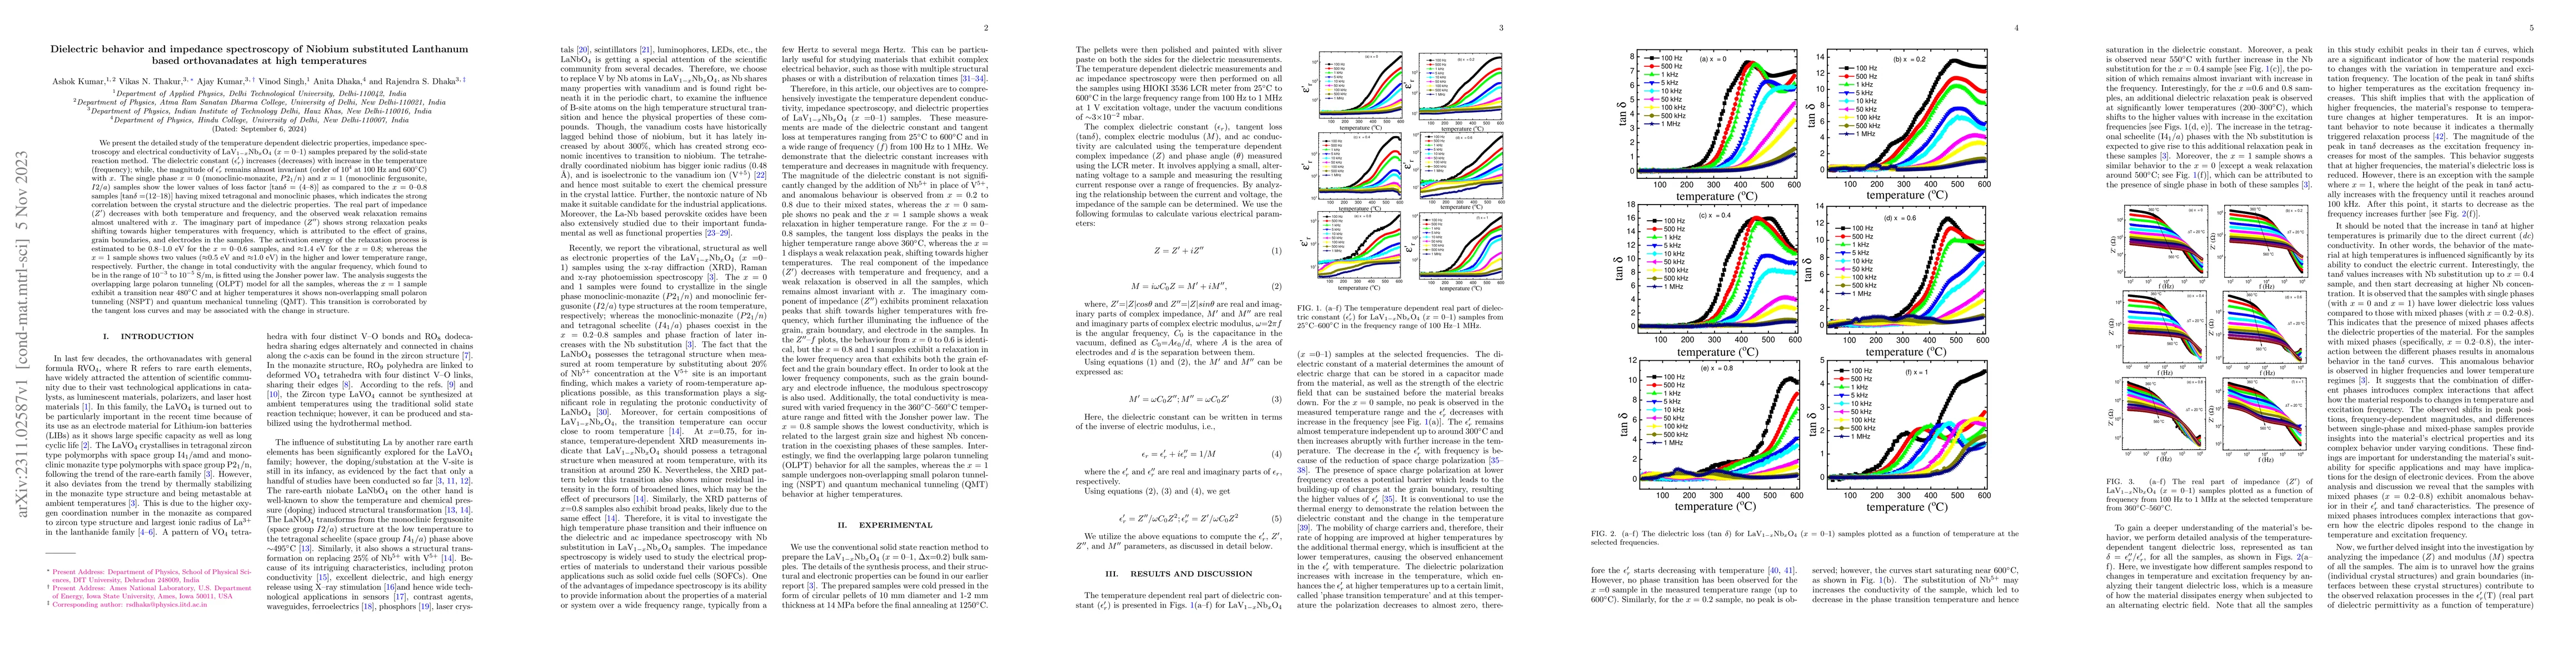
We present the detailed study of the temperature dependent dielectric properties, impedance spectroscopy and electrical conductivity of LaV$_{1-x}$Nb$_x$O$_4$ ($x=$ 0-1) samples prepared by the solid-state reaction method. The dielectric constant ($\epsilon_r'$) increases (decreases) with increase in the temperature (frequency); while, the magnitude of $\epsilon_r'$ remains almost invariant (order of 10$^4$ at 100~Hz and 600\degree C) with $x$. The single phase $x=$ 0 (monoclinic-monazite, $P2_1/n$) and $x =$ 1 (monoclinic fergusonite, $I2/a$) samples show the lower values of loss factor [tan$\delta=$ (4-8)] as compared to the $x=$ 0-0.8 samples [tan$\delta=$(12-18)] having mixed tetragonal and monoclinic phases, which indicates the strong correlation between the crystal structure and the dielectric properties. The real part of impedance decreases with both temperature and frequency, and the observed weak relaxation remains almost unaltered with $x$. The imaginary part of impedance shows strong relaxation peaks shifting towards higher temperatures with frequency, which is attributed to the effect of grains, grain boundaries, and electrodes in the samples. The activation energy of the relaxation process is estimated to be 0.8-1.0~eV for the $x=$ 0-0.6 samples, and $\approx$1.4~eV for the $x=$ 0.8; whereas the $x=$ 1 sample shows two values ($\approx$0.5~eV and $\approx$1.0~eV) in the higher and lower temperature range, respectively. Further, the change in total conductivity with the angular frequency, which found to be in the range of 10$^{-3}$ to 10$^{-5}$~S/m, is fitted using the Jonsher power law. The analysis suggests the OLPT model for all the samples, whereas the $x$ = 1 sample exhibit a transition near 480\degree C and at higher temperatures it shows NSPT and QMT. This transition is corroborated by the tangent loss curves and may be associated with the change in structure.
AI Key Findings
Get AI-generated insights about this paper's methodology, results, and significance.
Paper Details
PDF Preview
Key Terms
Citation Network
Current paper (gray), citations (green), references (blue)
Display is limited for performance on very large graphs.
Similar Papers
Found 4 papersHigh temperature dielectric and impedance spectroscopy study of LaCo$_{0.7}$Nb$_{0.3}$O$_3$
Ajay Kumar, Rajendra S. Dhaka, Vikas N. Thakur et al.
Performance of high impedance resonators in dirty dielectric environments
Jann H. Ungerer, Artem Kononov, Deepankar Sarmah et al.
| Title | Authors | Year | Actions |
|---|
Comments (0)