DiffSeer: Difference-based Dynamic Weighted Graph Visualization
Publication
Metrics
AI Quick Summary
DiffSeer proposes a novel visualization method for dynamic weighted graphs by explicitly showing differences between adjacent timeslices, using a nested matrix design and optimization-based node reordering to highlight temporal evolution and structure details. Evaluation through case studies and user interviews shows its effectiveness.
Paper Preview
Abstract
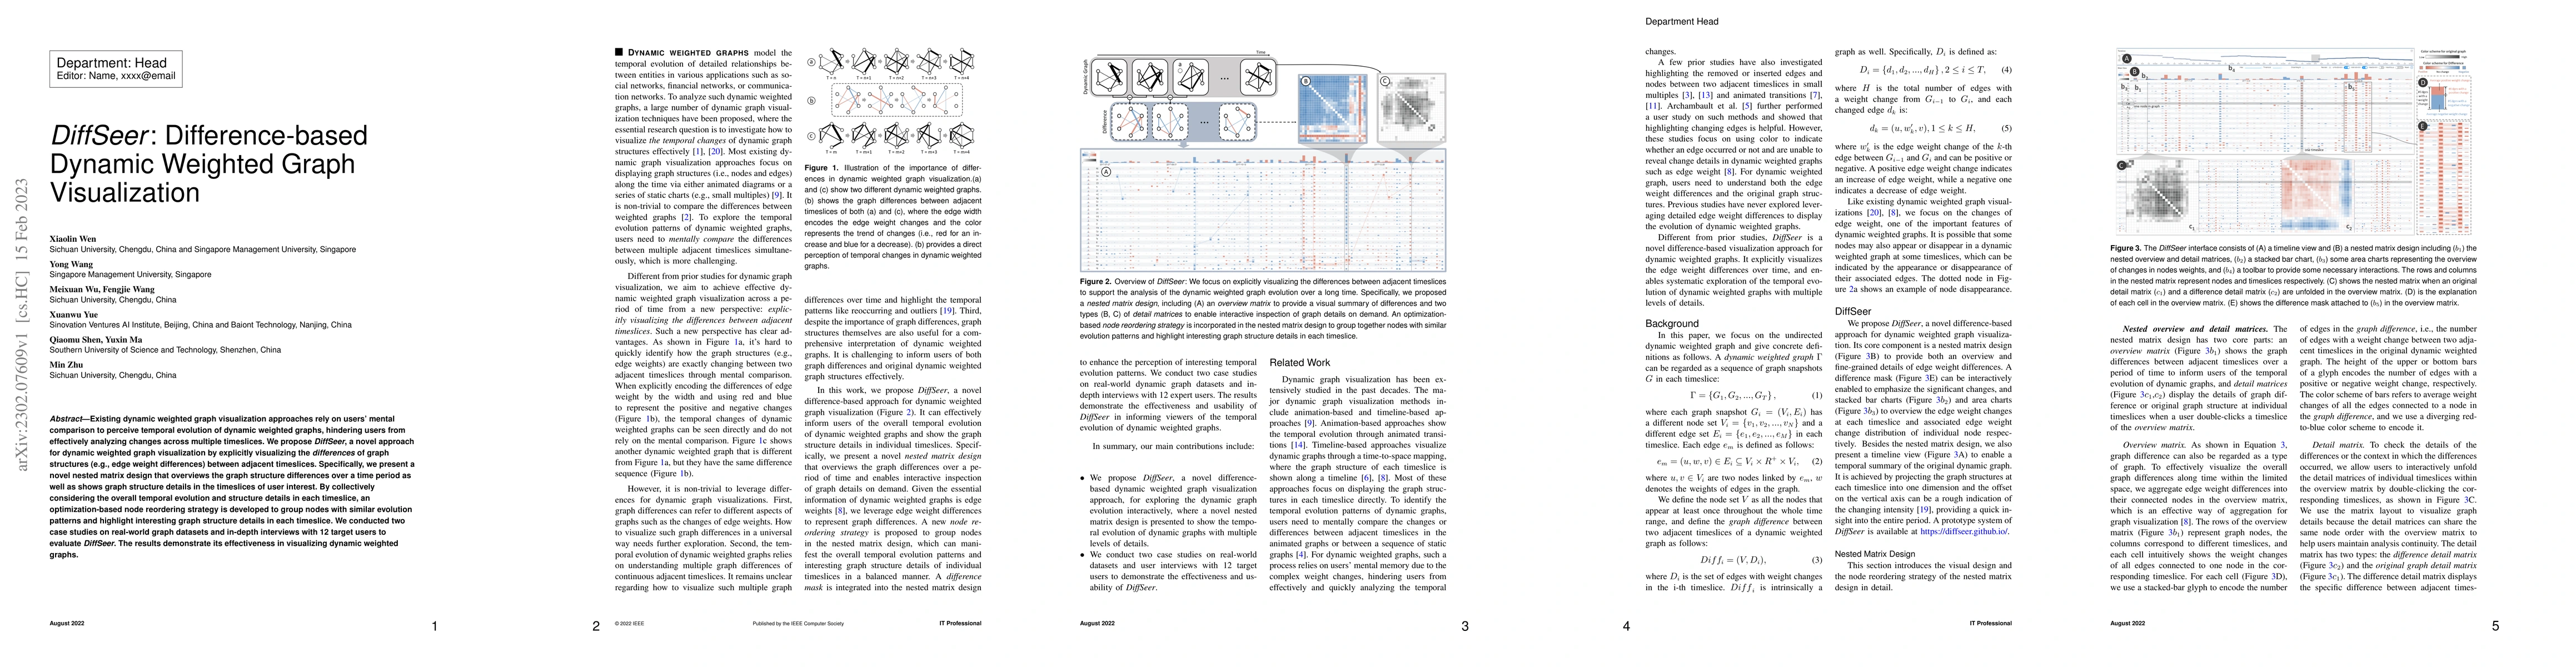
Existing dynamic weighted graph visualization approaches rely on users' mental comparison to perceive temporal evolution of dynamic weighted graphs, hindering users from effectively analyzing changes across multiple timeslices. We propose DiffSeer, a novel approach for dynamic weighted graph visualization by explicitly visualizing the differences of graph structures (e.g., edge weight differences) between adjacent timeslices. Specifically, we present a novel nested matrix design that overviews the graph structure differences over a time period as well as shows graph structure details in the timeslices of user interest. By collectively considering the overall temporal evolution and structure details in each timeslice, an optimization-based node reordering strategy is developed to group nodes with similar evolution patterns and highlight interesting graph structure details in each timeslice. We conducted two case studies on real-world graph datasets and in-depth interviews with 12 target users to evaluate DiffSeer. The results demonstrate its effectiveness in visualizing dynamic weighted graphs.
AI Key Findings
Get AI-generated insights about this paper's methodology, results, significance, and more — seven facets brought into focus.
Impact
Paper Details
Authors
PDF Preview
Key Terms
Citation Network
Current paper (gray), citations (green), references (blue)
Display is limited for performance on very large graphs.
Discussion 0