Digital breadcrumbs: Detecting urban mobility patterns and transport mode choices from cellphone networks
Publication
Metrics
Paper Preview
Abstract
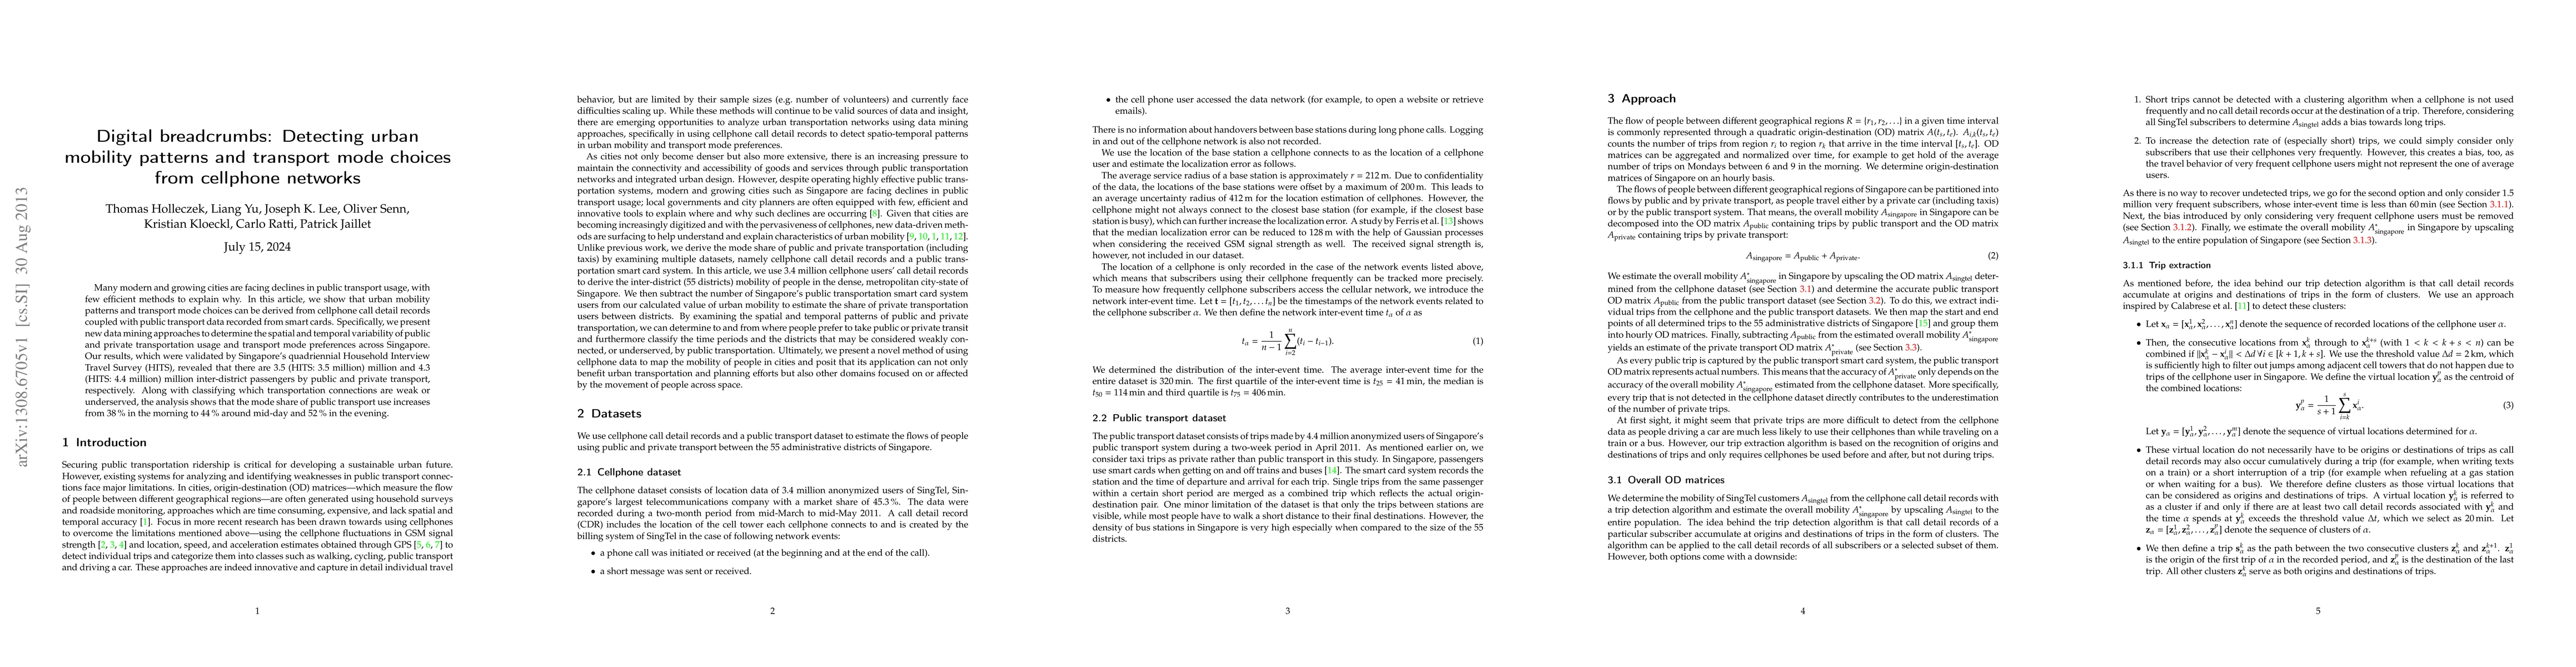
Many modern and growing cities are facing declines in public transport usage, with few efficient methods to explain why. In this article, we show that urban mobility patterns and transport mode choices can be derived from cellphone call detail records coupled with public transport data recorded from smart cards. Specifically, we present new data mining approaches to determine the spatial and temporal variability of public and private transportation usage and transport mode preferences across Singapore. Our results, which were validated by Singapore's quadriennial Household Interview Travel Survey (HITS), revealed that there are 3.5 (HITS: 3.5 million) million and 4.3 (HITS: 4.4 million) million inter-district passengers by public and private transport, respectively. Along with classifying which transportation connections are weak or underserved, the analysis shows that the mode share of public transport use increases from 38 percent in the morning to 44 percent around mid-day and 52 percent in the evening.
AI Key Findings
Get AI-generated insights about this paper's methodology, results, significance, and more — seven facets brought into focus.
Impact
Paper Details
PDF Preview
Key Terms
Citation Network
Current paper (gray), citations (green), references (blue)
Display is limited for performance on very large graphs.
Discussion 0