Publication
Metrics
AI Quick Summary
Researchers digitized Gustav Sp"orer's sunspot drawings from 1861-1894 to create detailed charts for almost 450 solar rotation periods, enabling precise tracking of individual sunspots and assessment of solar activity.
Paper Preview
Abstract
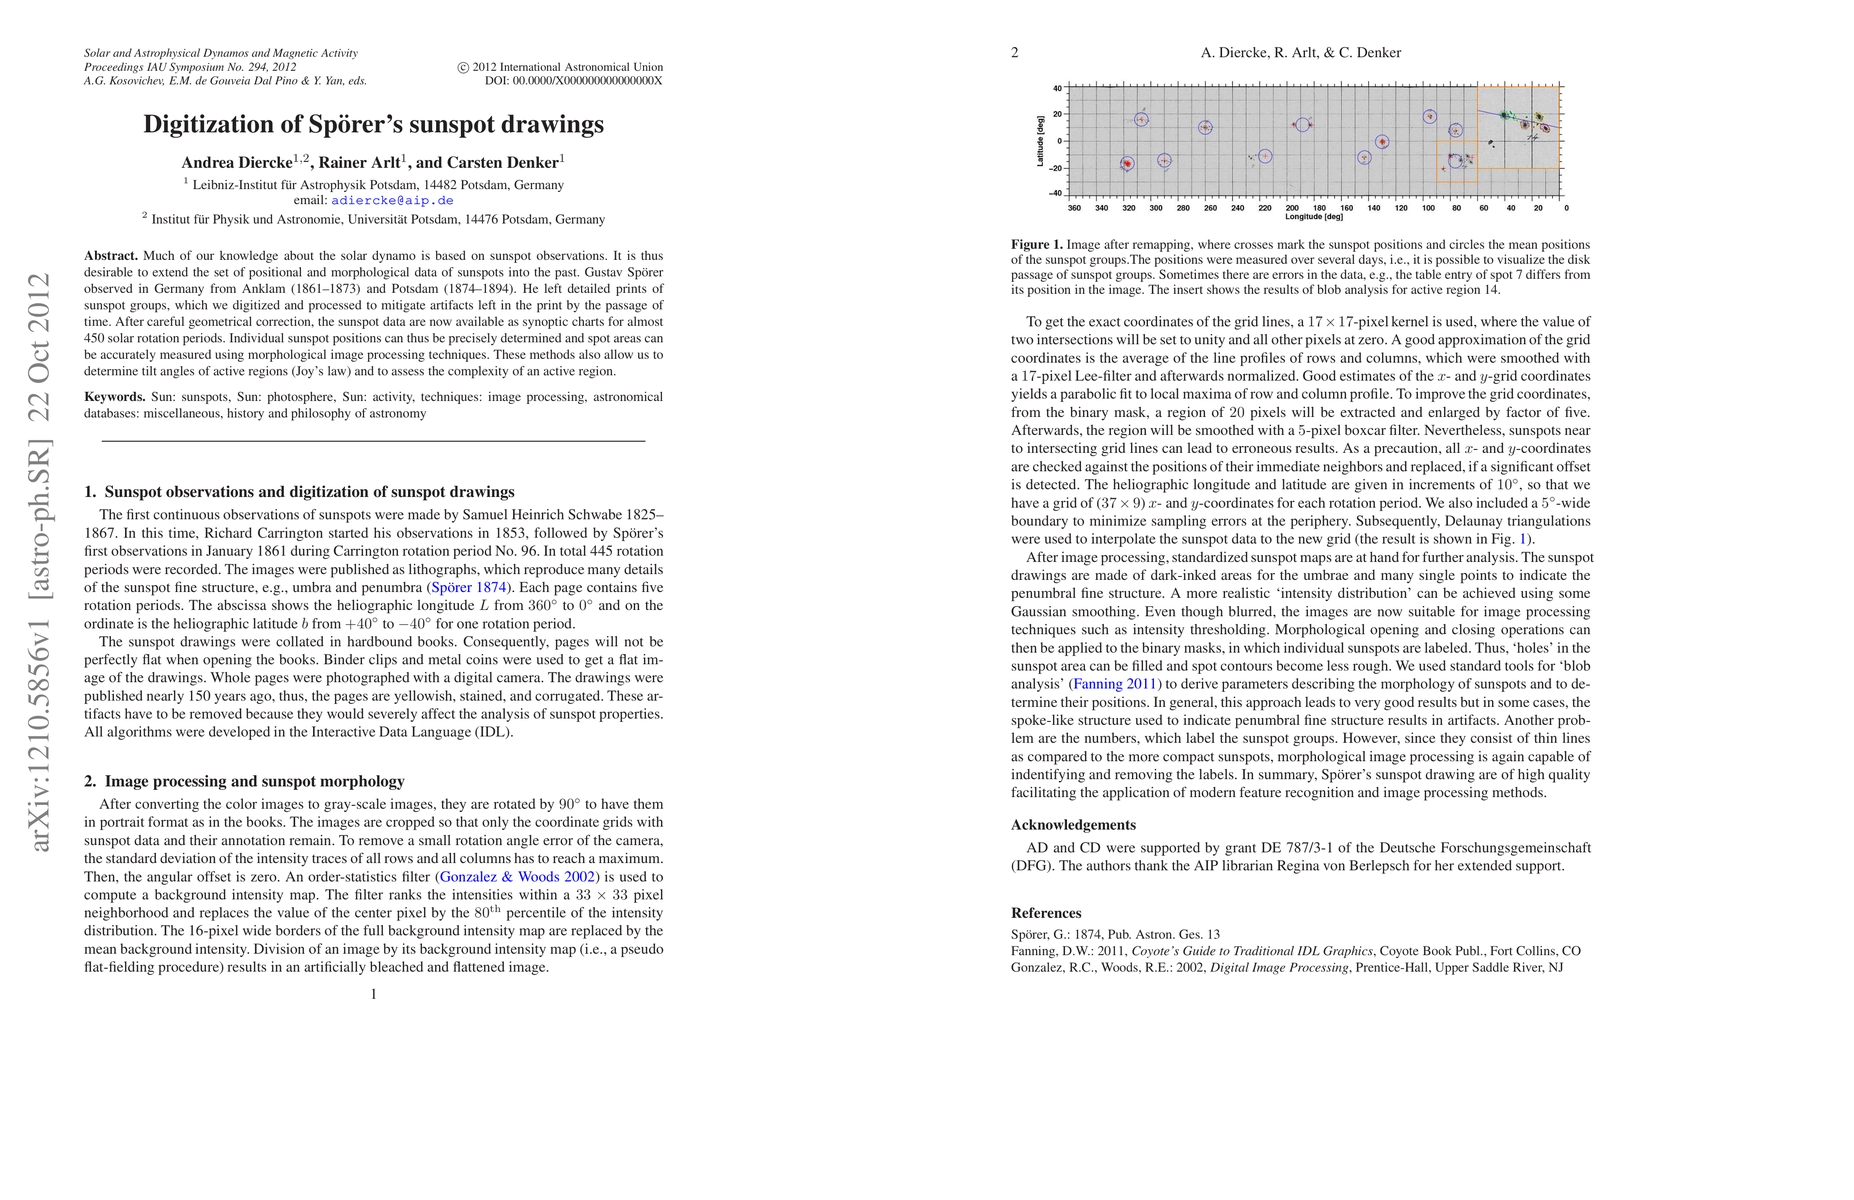
Much of our knowledge about the solar dynamo is based on sunspot observations. It is thus desirable to extend the set of positional and morphological data of sunspots into the past. Gustav Sp\"orer observed in Germany from Anklam (1861-1873) and Potsdam (1874-1894). He left detailed prints of sunspot groups, which we digitized and processed to mitigate artifacts left in the print by the passage of time. After careful geometrical correction, the sunspot data are now available as synoptic charts for almost 450 solar rotation periods. Individual sunspot positions can thus be precisely determined and spot areas can be accurately measured using morphological image processing techniques. These methods also allow us to determine tilt angles of active regions (Joy's law) and to assess the complexity of an active region.
AI Key Findings
Get AI-generated insights about this paper's methodology, results, significance, and more — seven facets brought into focus.
Impact
Paper Details
PDF Preview
Key Terms
Citation Network
Current paper (gray), citations (green), references (blue)
Display is limited for performance on very large graphs.
Discussion 0