Publication
Metrics
AI Quick Summary
This paper introduces a graphical model called the minimal generative model graph to represent networks of stochastic processes, showing its equivalence to directed information graphs based on Granger causality. It proposes efficient algorithms for estimating the graph's structure from data, evaluates their sample-complexity, and demonstrates their effectiveness on both synthetic and real-world Twitter data.
Paper Preview
Abstract
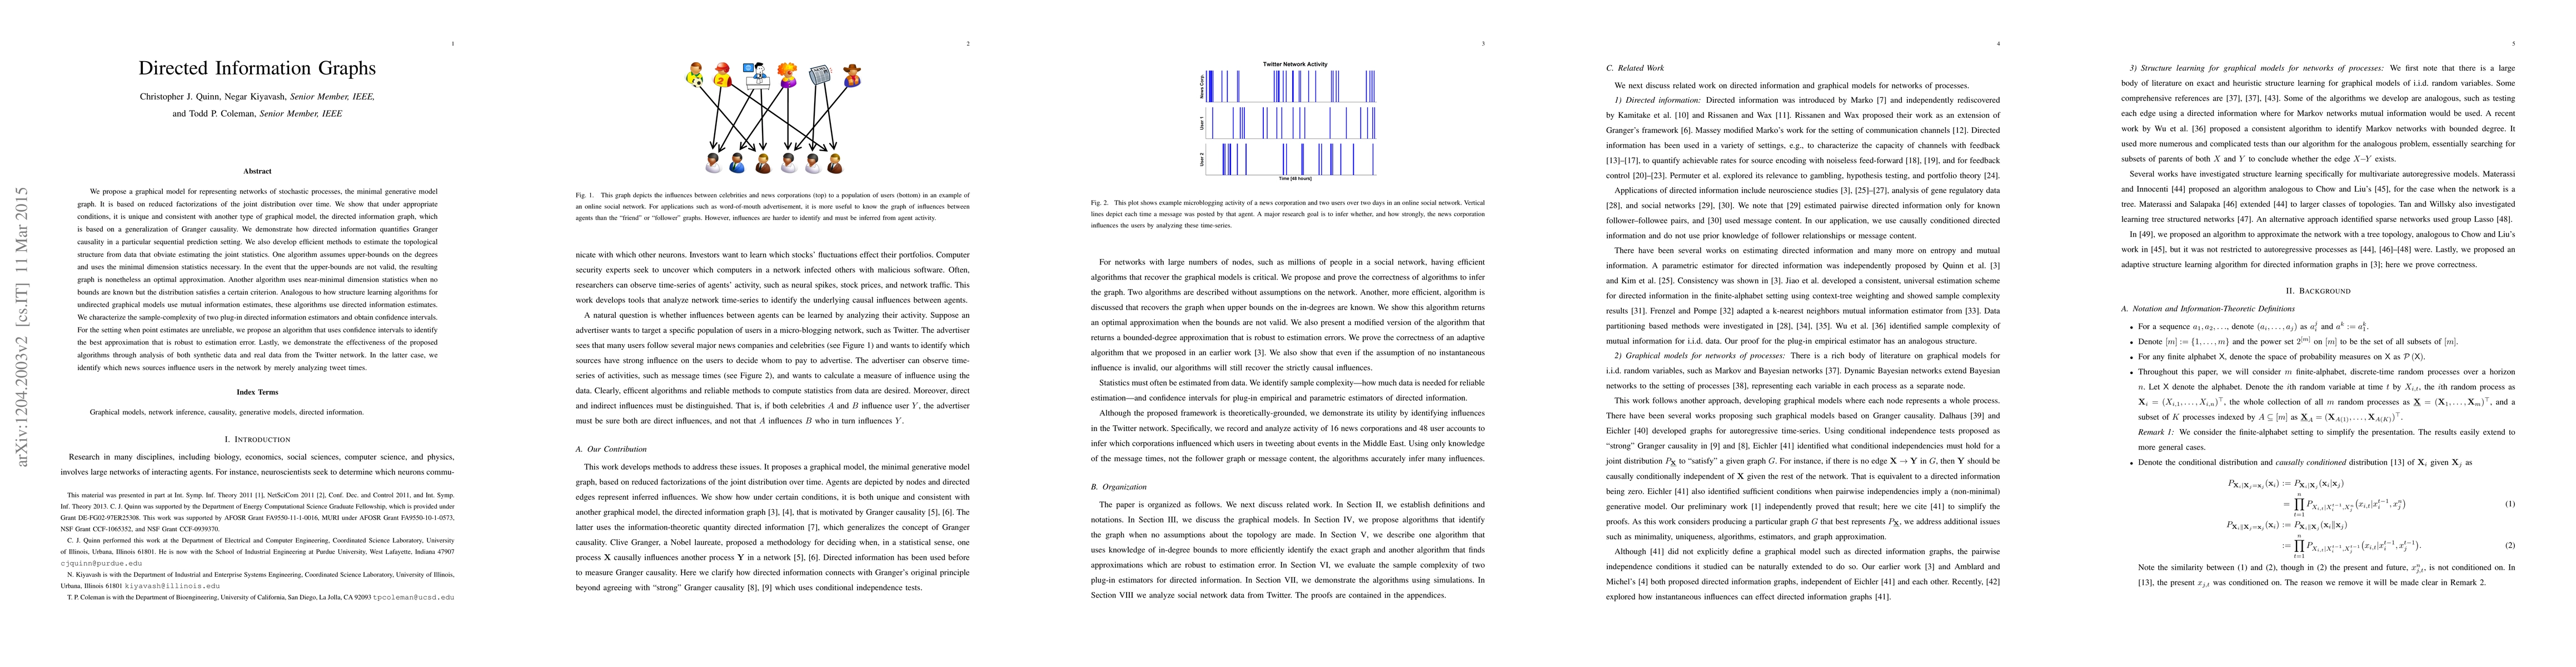
We propose a graphical model for representing networks of stochastic processes, the minimal generative model graph. It is based on reduced factorizations of the joint distribution over time. We show that under appropriate conditions, it is unique and consistent with another type of graphical model, the directed information graph, which is based on a generalization of Granger causality. We demonstrate how directed information quantifies Granger causality in a particular sequential prediction setting. We also develop efficient methods to estimate the topological structure from data that obviate estimating the joint statistics. One algorithm assumes upper-bounds on the degrees and uses the minimal dimension statistics necessary. In the event that the upper-bounds are not valid, the resulting graph is nonetheless an optimal approximation. Another algorithm uses near-minimal dimension statistics when no bounds are known but the distribution satisfies a certain criterion. Analogous to how structure learning algorithms for undirected graphical models use mutual information estimates, these algorithms use directed information estimates. We characterize the sample-complexity of two plug-in directed information estimators and obtain confidence intervals. For the setting when point estimates are unreliable, we propose an algorithm that uses confidence intervals to identify the best approximation that is robust to estimation error. Lastly, we demonstrate the effectiveness of the proposed algorithms through analysis of both synthetic data and real data from the Twitter network. In the latter case, we identify which news sources influence users in the network by merely analyzing tweet times.
AI Key Findings
Get AI-generated insights about this paper's methodology, results, significance, and more — seven facets brought into focus.
Impact
Paper Details
PDF Preview
Key Terms
Citation Network
Current paper (gray), citations (green), references (blue)
Display is limited for performance on very large graphs.
Discussion 0