Discovering Interpretable Machine Learning Models in Parallel Coordinates
Publication
Metrics
AI Quick Summary
This paper proposes a new algorithm to discover interpretable machine learning models in parallel coordinates, enabling users to visualize patterns and avoid overfitting and data overgeneralization.
Paper Preview
Abstract
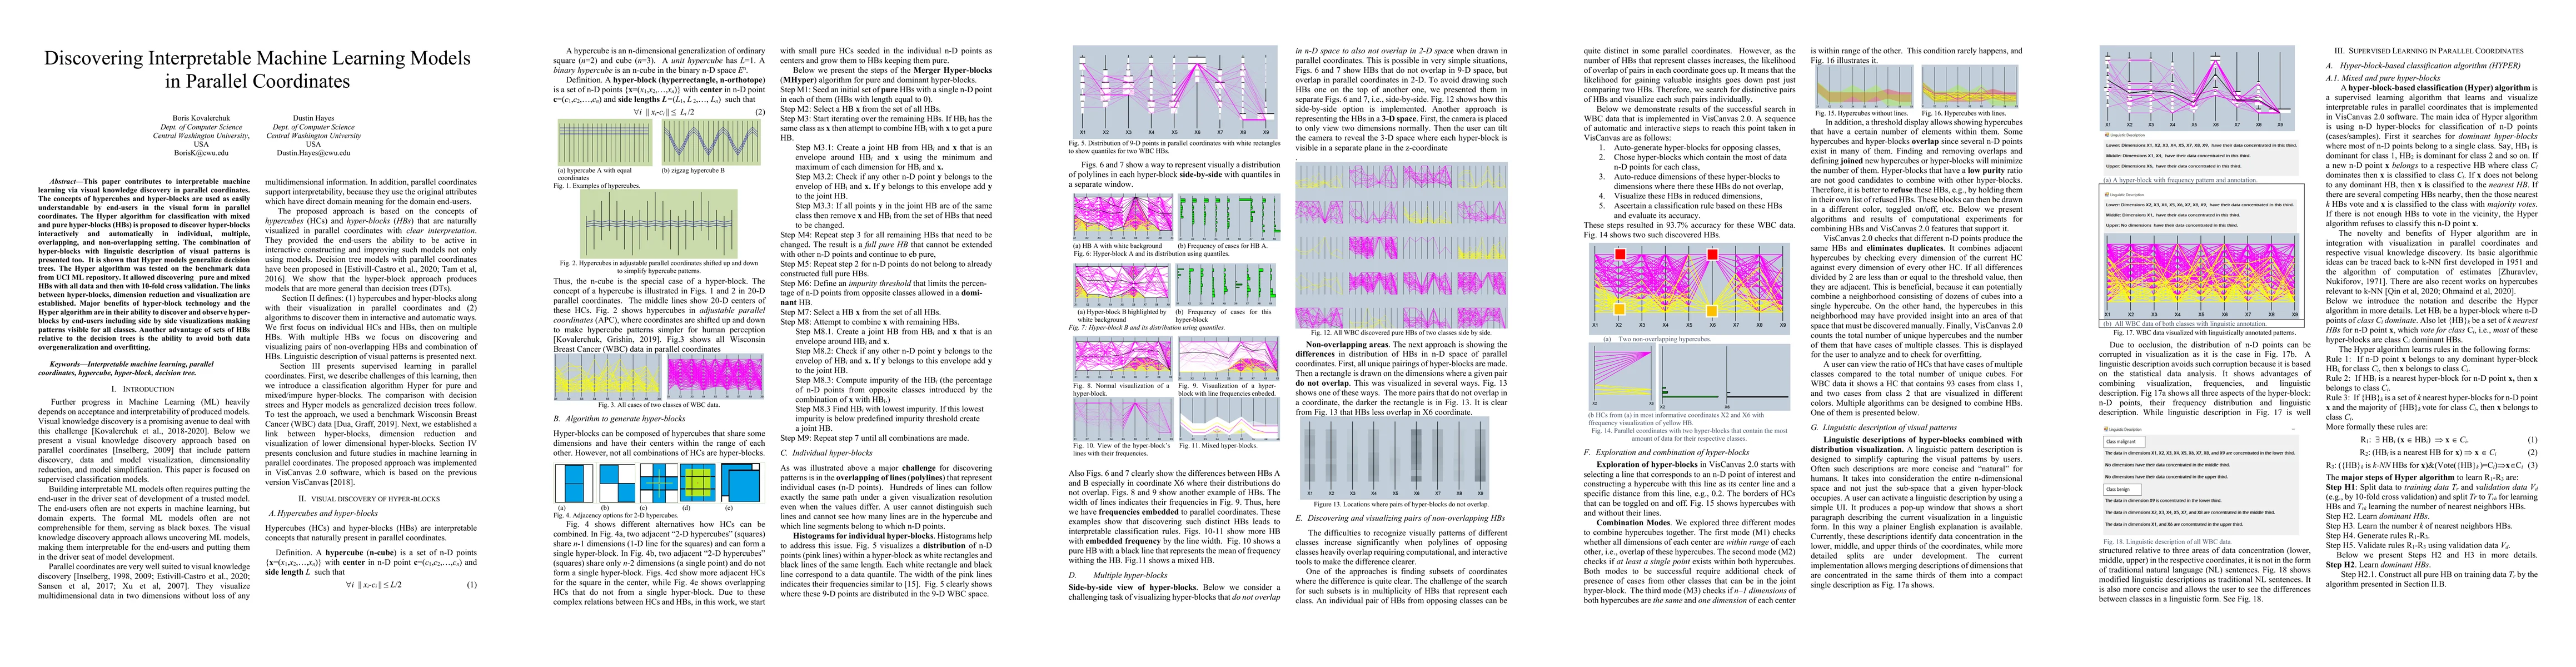
This paper contributes to interpretable machine learning via visual knowledge discovery in parallel coordinates. The concepts of hypercubes and hyper-blocks are used as easily understandable by end-users in the visual form in parallel coordinates. The Hyper algorithm for classification with mixed and pure hyper-blocks (HBs) is proposed to discover hyper-blocks interactively and automatically in individual, multiple, overlapping, and non-overlapping setting. The combination of hyper-blocks with linguistic description of visual patterns is presented too. It is shown that Hyper models generalize decision trees. The Hyper algorithm was tested on the benchmark data from UCI ML repository. It allowed discovering pure and mixed HBs with all data and then with 10-fold cross validation. The links between hyper-blocks, dimension reduction and visualization are established. Major benefits of hyper-block technology and the Hyper algorithm are in their ability to discover and observe hyper-blocks by end-users including side by side visualizations making patterns visible for all classes. Another advantage of sets of HBs relative to the decision trees is the ability to avoid both data overgeneralization and overfitting.
AI Key Findings
Get AI-generated insights about this paper's methodology, results, significance, and more — seven facets brought into focus.
Impact
Paper Details
PDF Preview
Key Terms
Citation Network
Current paper (gray), citations (green), references (blue)
Display is limited for performance on very large graphs.
Discussion 0